Evaluate
Know where you are heading
before the quarter ends.
Most organisations evaluate performance after it has already happened. Evaluate gives leaders an AI-powered forward view — forecasting OKR achievement, surfacing department health at a glance, and putting the KPIs that matter directly in front of the leaders who need to act on them.
Step 3 of the DEEP AI Framework. Where check-in data and progress signals become forward-looking intelligence — so course correction is possible before the quarter is already lost.
Evaluate features
Forward-looking intelligence.
Not just a mirror of what happened.
Every Evaluate feature is built around the same question: what does the current data tell us about where we are going — and what can we still do about it?
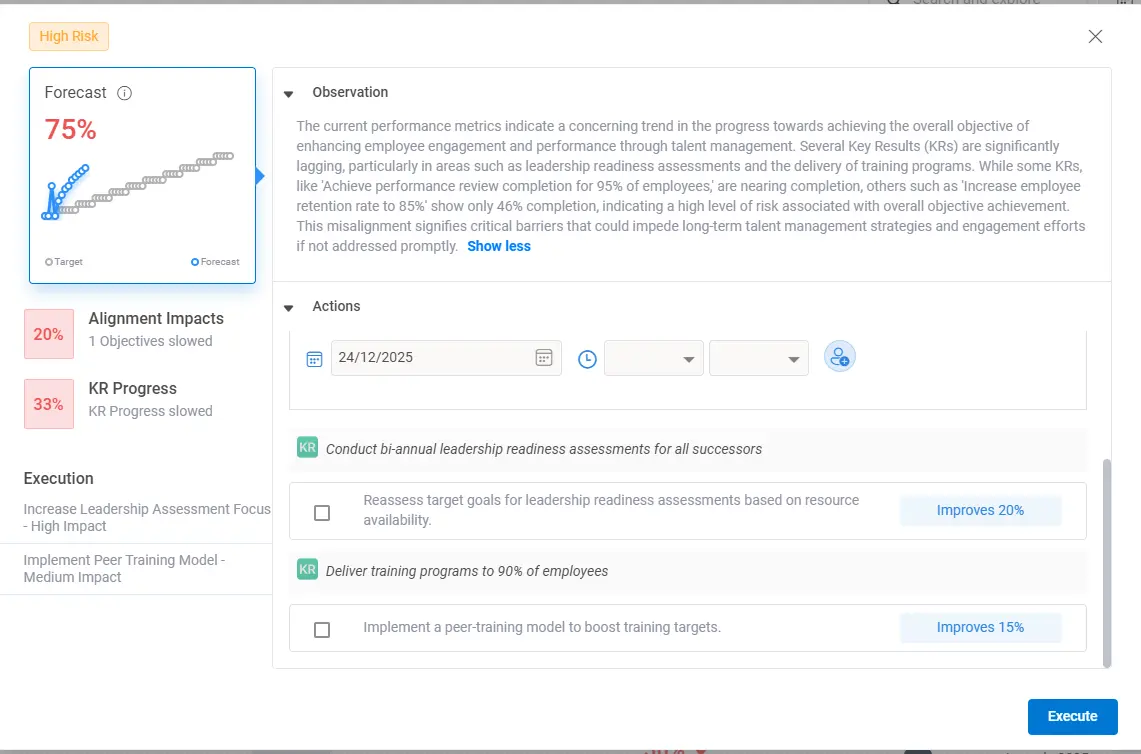
Know your OKR achievement probability while there is still time to change it.
Conversate with real trajectory shifts. Worxmate's AI Forecasting engine reads check-in progress rates, confidence score trends, task completion velocity and historical performance patterns to calculate the probability of each Key Result being achieved by quarter end. Updated continuously — not just at the review meeting. When a KR drops below a healthy achievement probability, the relevant manager and leader are alerted with a specific recovery recommendation, not just a red status flag.
- Achievement probability per KR updated continuously from check-in and task data
- At-risk KRs flagged proactively to manager and leader with lead time to act
- Axis AI reads forecast data to isolate the fastest recovery lever when a KR falls behind
- Trend lines show whether trajectory is improving, stable or deteriorating week-on-week
- Confidence score changes modelled alongside progress — leading indicator of risk
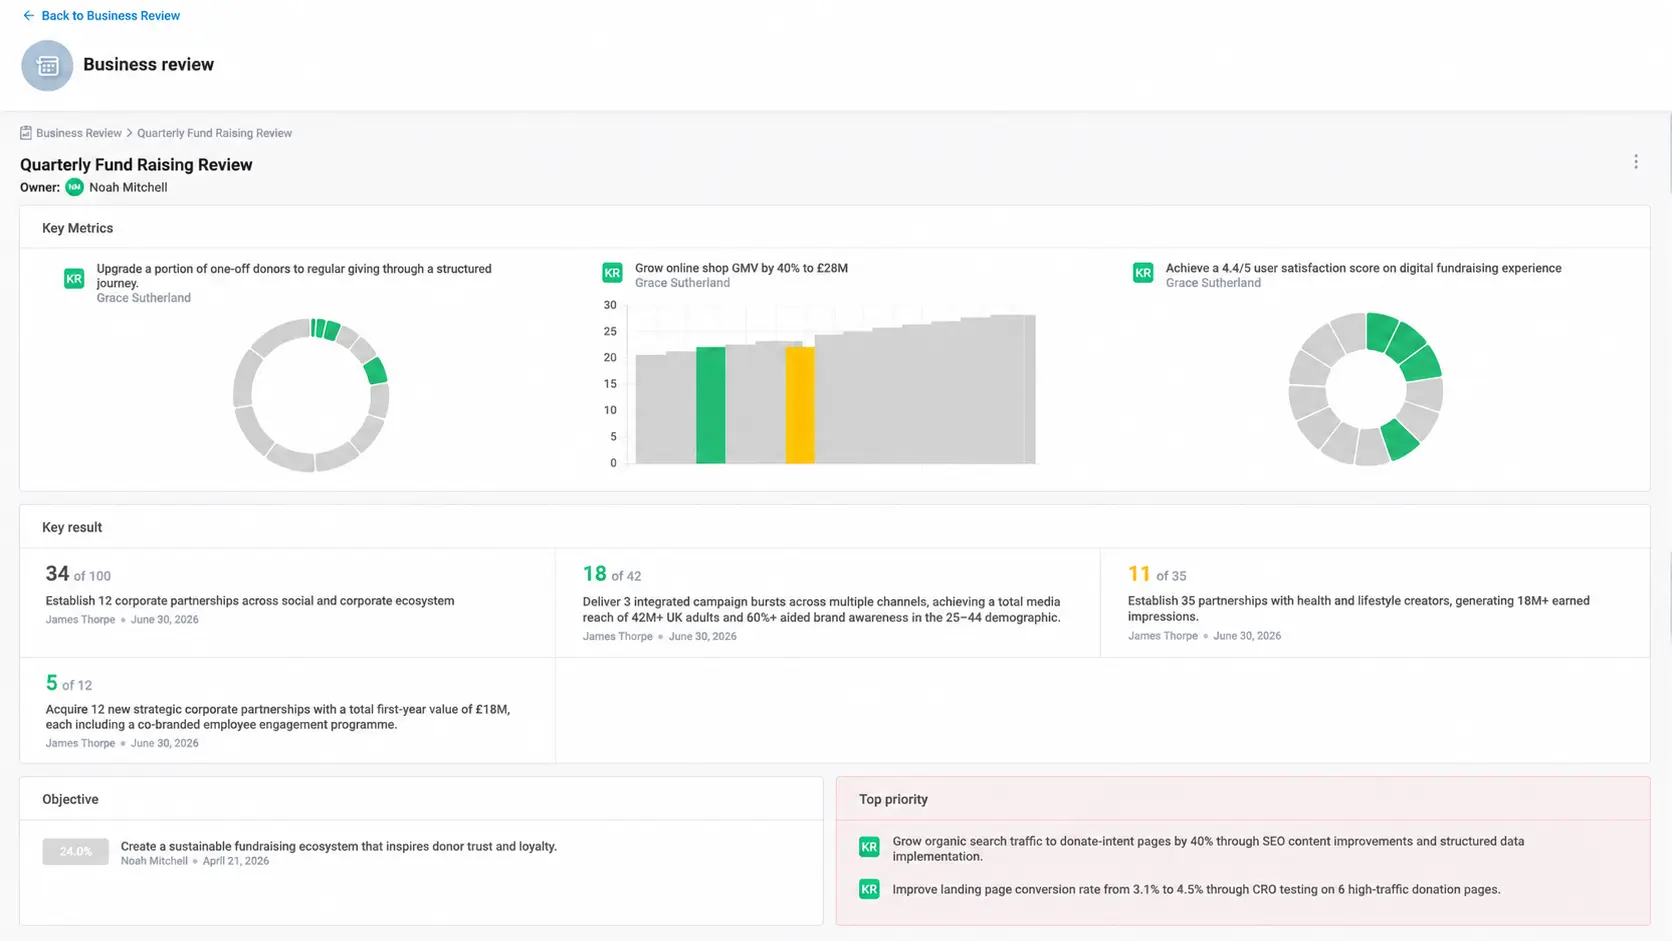
Walk into every leadership meeting with the data already prepared.
The Business Review dashboard pulls live OKR progress, forecast data and team performance signals into a structured format ready for leadership meetings, board updates and executive reviews — without manual preparation. The OKR Scorecard sits alongside it as the real-time health report: completion rates, confidence trends, at-risk flags and contribution scores across individuals, teams and business units in one view.
- Business Review formatted for leadership meetings — zero manual data assembly
- Scorecard shows completion rates, confidence trends and at-risk flags across all levels
- BU-level and team-level rollups with drill-down to individual OKR detail
- Historical scorecard comparison — this quarter vs last quarter side-by-side
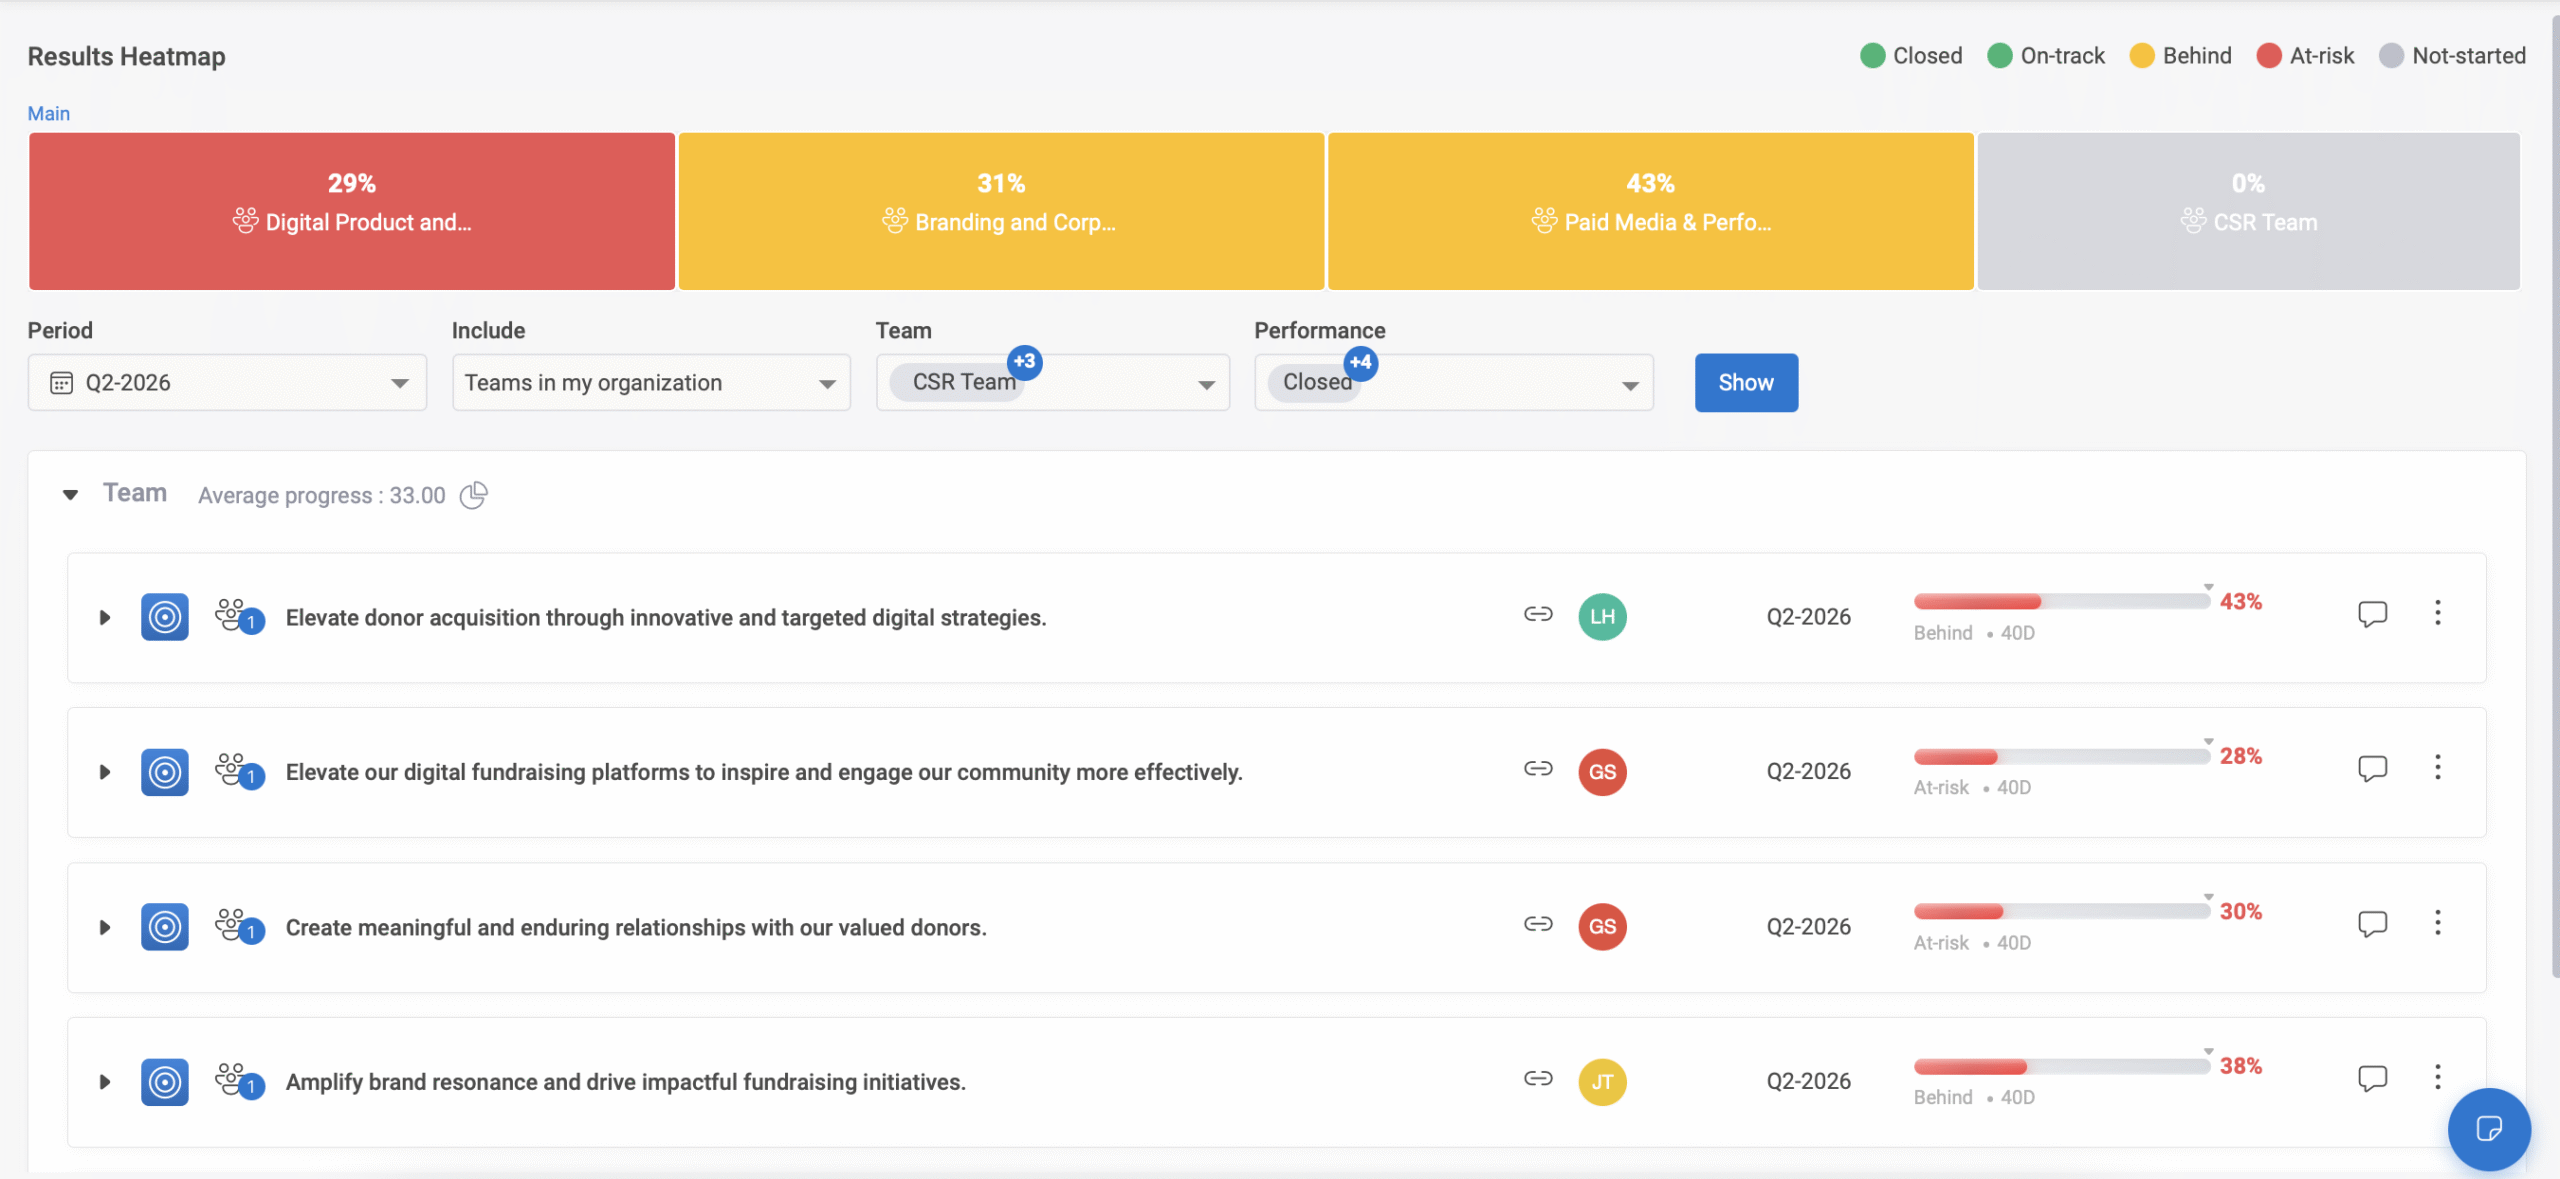
The health of your entire organisation in one glance.
When you are responsible for multiple departments or business units, the most valuable thing you can see first is which departments are on track, which need attention and which are in trouble — without opening each one individually. The Department Heatmap shows RAG status across every department simultaneously, with OKR completion rates, confidence trends and at-risk counts visible at the cell level.
- RAG status across all departments in a single visual — green, amber, red at a glance
- OKR completion rate, average confidence score and at-risk KR count visible per cell
- Click any department cell to drill into the specific OKRs driving its status
- Heatmap updated in real time as check-ins and task completions flow in
- Filter by quarter, objective type, owner level or business unit cluster
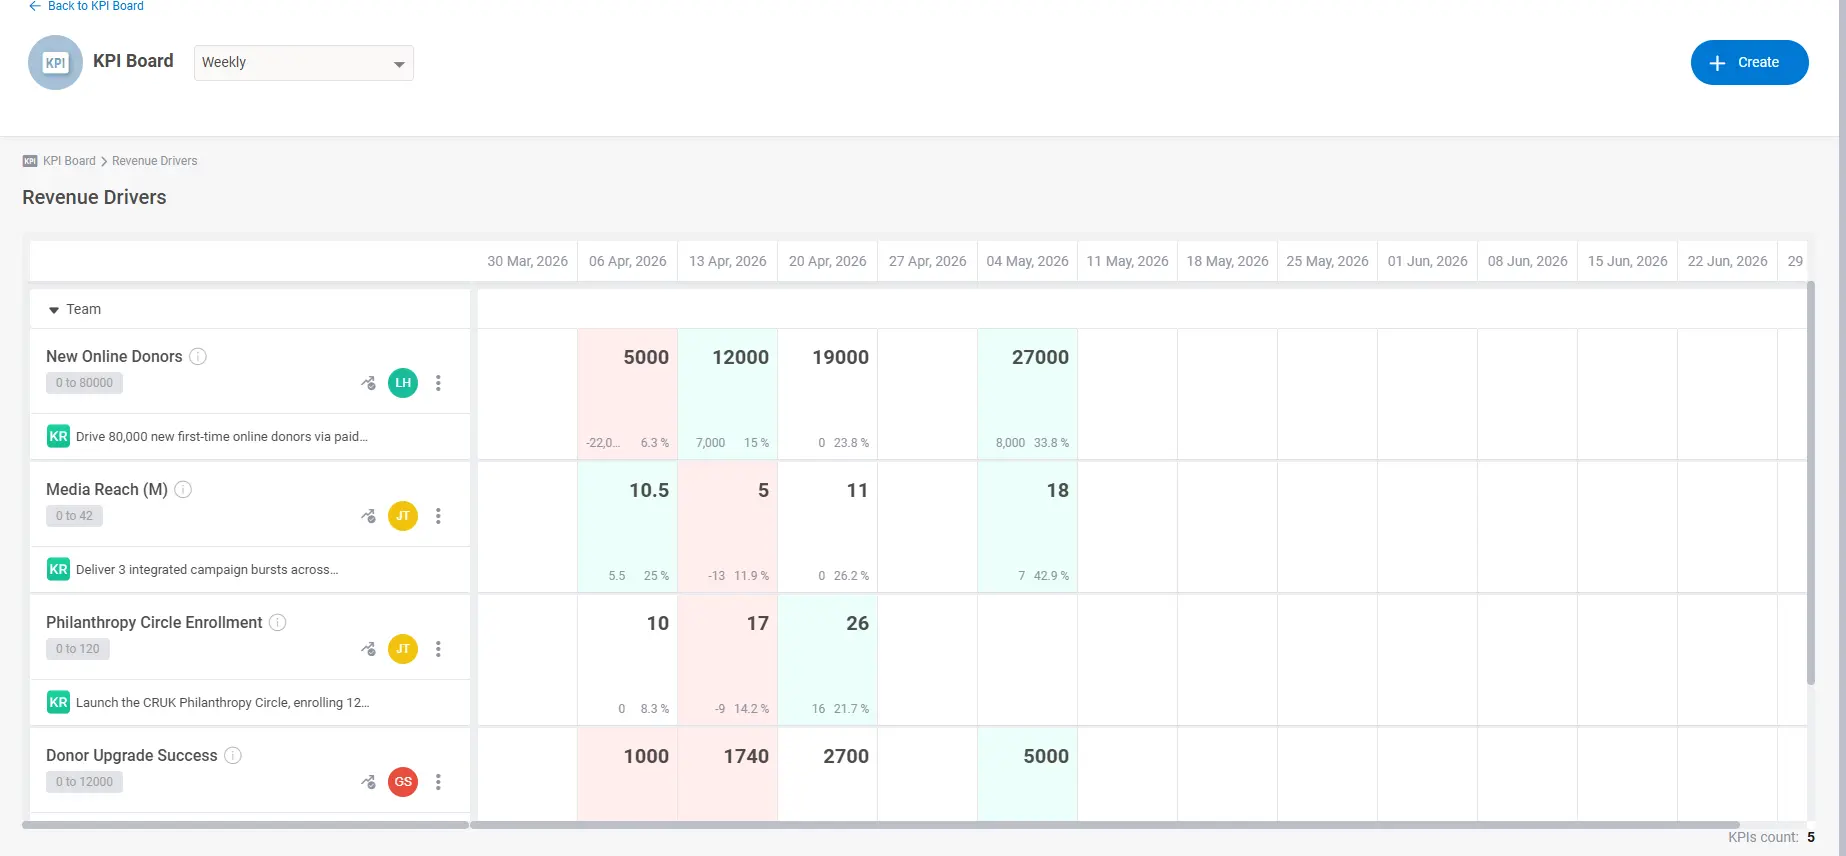
The KPIs your leaders care about — without navigating through OKRs to find them.
Many leaders want to see business KPIs directly — not hunt for them inside OKR progress windows. KPI Boards is a separate dashboard layer where each leader selects the KPIs they want to monitor, linked to the KRs that drive them, and sees live progress in the format most useful to their decision-making. The CEO board looks different from the Sales Head board, and both are configured in minutes.
- Leader selects which KPIs to display — fully configurable per user
- Each KPI is linked to the KR that drives it — progress is pulled live from OKR data
- Current value, target, variance and trend visible per KPI card
- Board is a direct entry point — leaders who prefer KPI views never need to enter the OKR interface
- Axis AI reads KPI board data alongside OKR data for business intelligence analysis
▶ Plan — Use what you learned to build what comes next
AI retrospective, OKR revision suggestions and next-quarter planning