 WORXMATE

How to measure OKR alignment: score your cascade on five measures: line-of-sight coverage, link integrity, priority coverage, dependency resolution and check-in cadence. Weight them 25, 25, 20, 15 and 15, add them up, and you have an OKR cascade health score out of 100. Above 85, OKR alignment is real. Between 50 and 69, the cascade is displayed but not agreed. Below 50, it is broken. Recalculate your OKR alignment score every quarter.
Eighty percent of the goals on that wall were pointing the wrong way.
It was day one of a three-day workshop with a listed fintech company. Thirty-five leaders in an auditorium, the MD in the front row. I asked every leader to write their current goals, the impact they expected and their biggest challenge on sticky notes, and put them on the wall. Then I asked the MD to walk the wall and tell the room what he saw.
He started out surprised. He finished convinced. About 80% of the goals had not been designed in the right direction. Every leader had a sensible goal. Together they added up to nothing the MD was trying to achieve.
That wall was the first OKR alignment assessment that organisation ever had. Most strategy heads I meet still run theirs by gut feel, which means they discover a broken cascade the way that MD did: in a room, in public, after the damage is done.
This article is about measuring it on purpose, every quarter, with a number you can put in front of a board. I call it the OKR cascade health score.
About the author: I am Madhusudan Nayak (Maddy), Co-Founder and CEO of Worxmate. I have spent 20+ years in strategy execution and 10+ years implementing OKRs across 50+ organisations, and I have trained 500+ leaders. This guide on OKR alignment for strategy heads comes from rooms like that auditorium, not from a textbook.
Why OKR Alignment Is Almost Never Measured
Ask a strategy head for the OKR completion rate and you will have it by Friday. Ask for the alignment rate and you will get a pause.
Completion is easy to count. Goal alignment measurement is not, so it gets skipped, and what gets skipped gets assumed. Leadership assumes the cascade worked because the tool shows a tree. That assumption is where the strategy to execution gap lives.
Completion rate is the most visible OKR alignment KPI and the least meaningful. A team can finish 80% of its OKRs and move nothing the business needed moved, if those OKRs were never tied to what the business needed. Measuring goal alignment has to sit next to completion, not behind it.
A cascade display feels like proof. It is not.
“You cannot set alignment in a tool. You can display it. You cannot create it.”
My definition is simple: Alignment = Agreement. It is agreement between teams on what matters, why it matters and how each team’s work connects to the teams around them. A beautifully cascaded OKR tree is the record of an agreement that either exists or does not. If it does not, the tree is a fiction. If you want the fundamentals first, read our piece on goal alignment. This guide assumes you have them and want to know whether yours holds.
How to Measure OKR Alignment: Vertical, Horizontal and Structural
To measure OKR alignment you need to separate three questions that usually get blurred into one.
Vertical alignment OKRs answer: does every team OKR connect to the strategic objective above it? This is your OKR line of sight, the chain from strategic objective to team OKR to the individual doing the work. It is what most OKR alignment metrics capture, and it is the easy part.
Horizontal alignment OKRs answer: do the teams that depend on each other know it, and have they agreed what each will deliver? This is where cross-functional work lives or dies, and almost no tool measures it.
Structural alignment answers: is the organisation even built to deliver this strategy? Org structure is an OKR pre-condition, not background detail. Cascading OKRs through a misaligned structure does not reveal the problem. It embeds it.
One more distinction. A top-down OKR cascade and bottom-up OKRs should not be measured against the same expectation. Bottom-up is the right destination, not the right starting point: in the first two quarters it produces noise. Expect early alignment to come from top-down OKR cascading with coaching at every level, then watch bottom-up contribution grow with capability. Empowerment without capability is misalignment dressed as autonomy.
Our guide to organizational alignment covers the concept. Organizational alignment metrics are the layer that follows.
Achieve Your Goals Faster
See how Worxmate can help your team set clear goals and achieve faster results. Book your free demo today and experience the power of AI-driven OKRs in action.
The OKR Cascade Health Score: A Five-Part OKR Alignment Framework
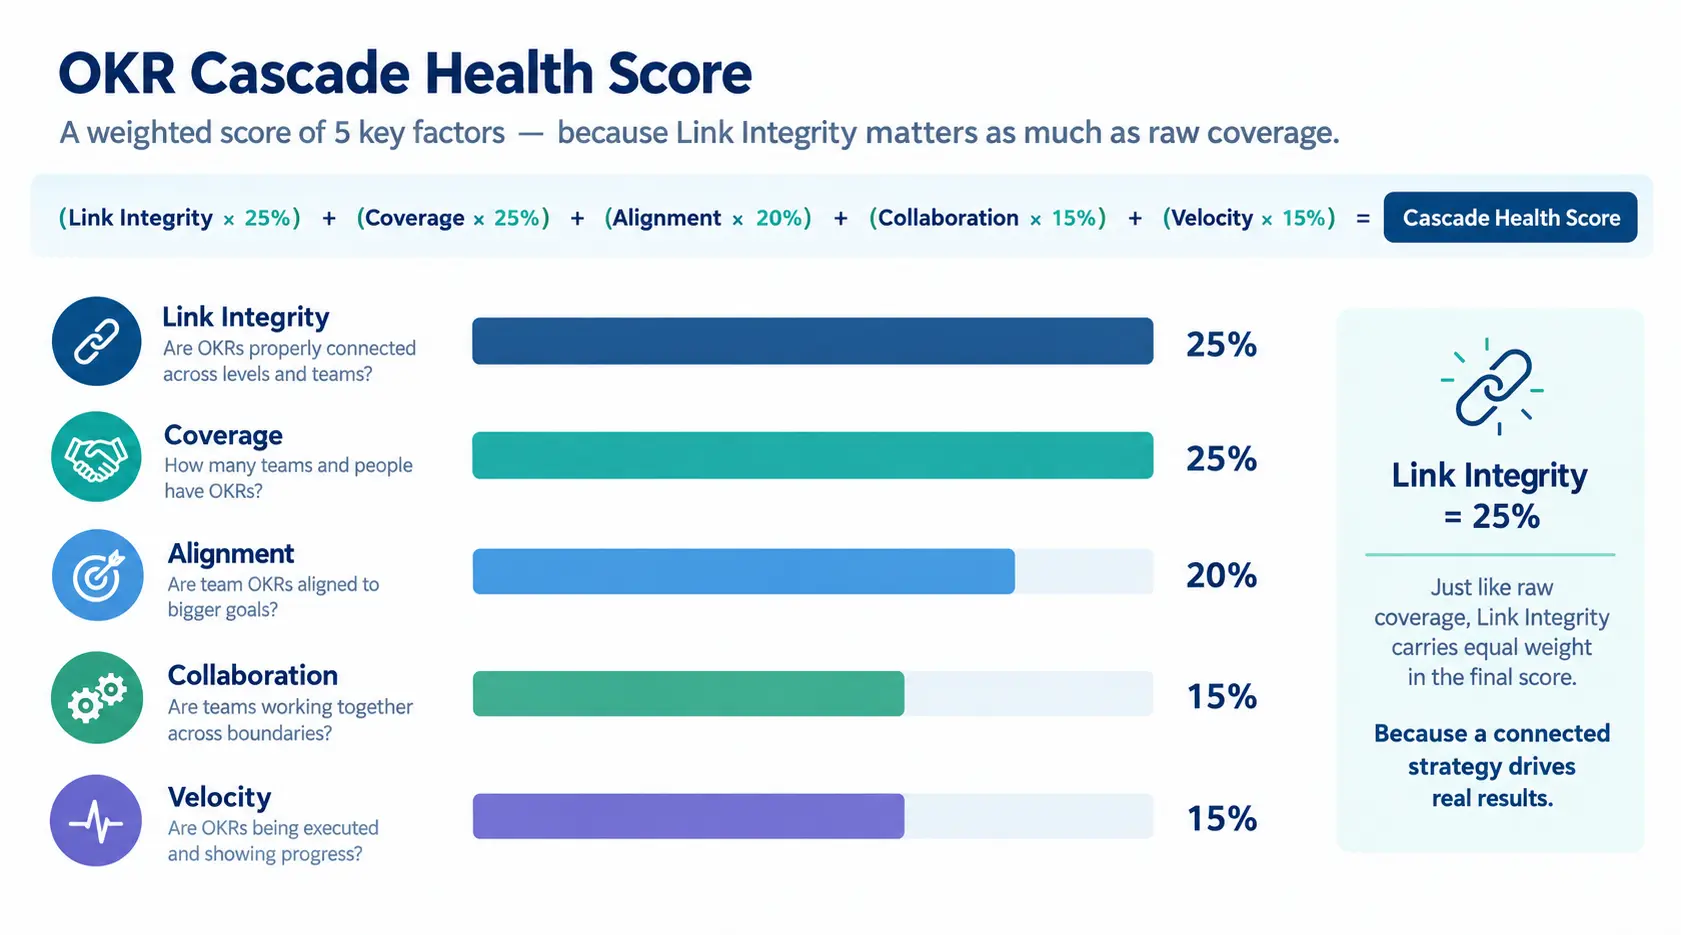
The OKR cascade health score turns five observable measures into one number from 0 to 100. Each measure is a rate between 0 and 1. Each carries a weight.
| # | Component | What it measures | How to calculate | Weight |
|---|---|---|---|---|
| 1 | Line-of-Sight Coverage | Share of team and individual OKRs linked to a parent objective | Linked OKRs ÷ total OKRs | 25 |
| 2 | Link Integrity | Share of links both owners can explain and confirm | Confirmed links ÷ total links | 25 |
| 3 | Priority Coverage | Share of company priorities with an owned KR at every level below | Covered priorities ÷ total priorities | 20 |
| 4 | Dependency Resolution | Share of declared cross-team dependencies the other team has acknowledged | Acknowledged ÷ declared | 15 |
| 5 | Cadence Signal | Share of KRs with a current, honest check-in | Current check-ins ÷ total KRs | 15 |
🎯That gives you the alignment score formula:
OKR cascade health score = (25 × LSC) + (25 × LI) + (20 × PC) + (15 × DR) + (15 × CS)
These are the weights I would start with. Run two cycles, then adjust them to your own data. The point of an OKR alignment framework is not the exact weights. It is that the number moves when something real changes.
1. Line-of-Sight Coverage: your alignment rate
This is the OKR coverage measure. Divide the OKRs covered by parent-child OKR linking by all OKRs. Then run it in reverse: which strategic objectives have no child OKR at all?
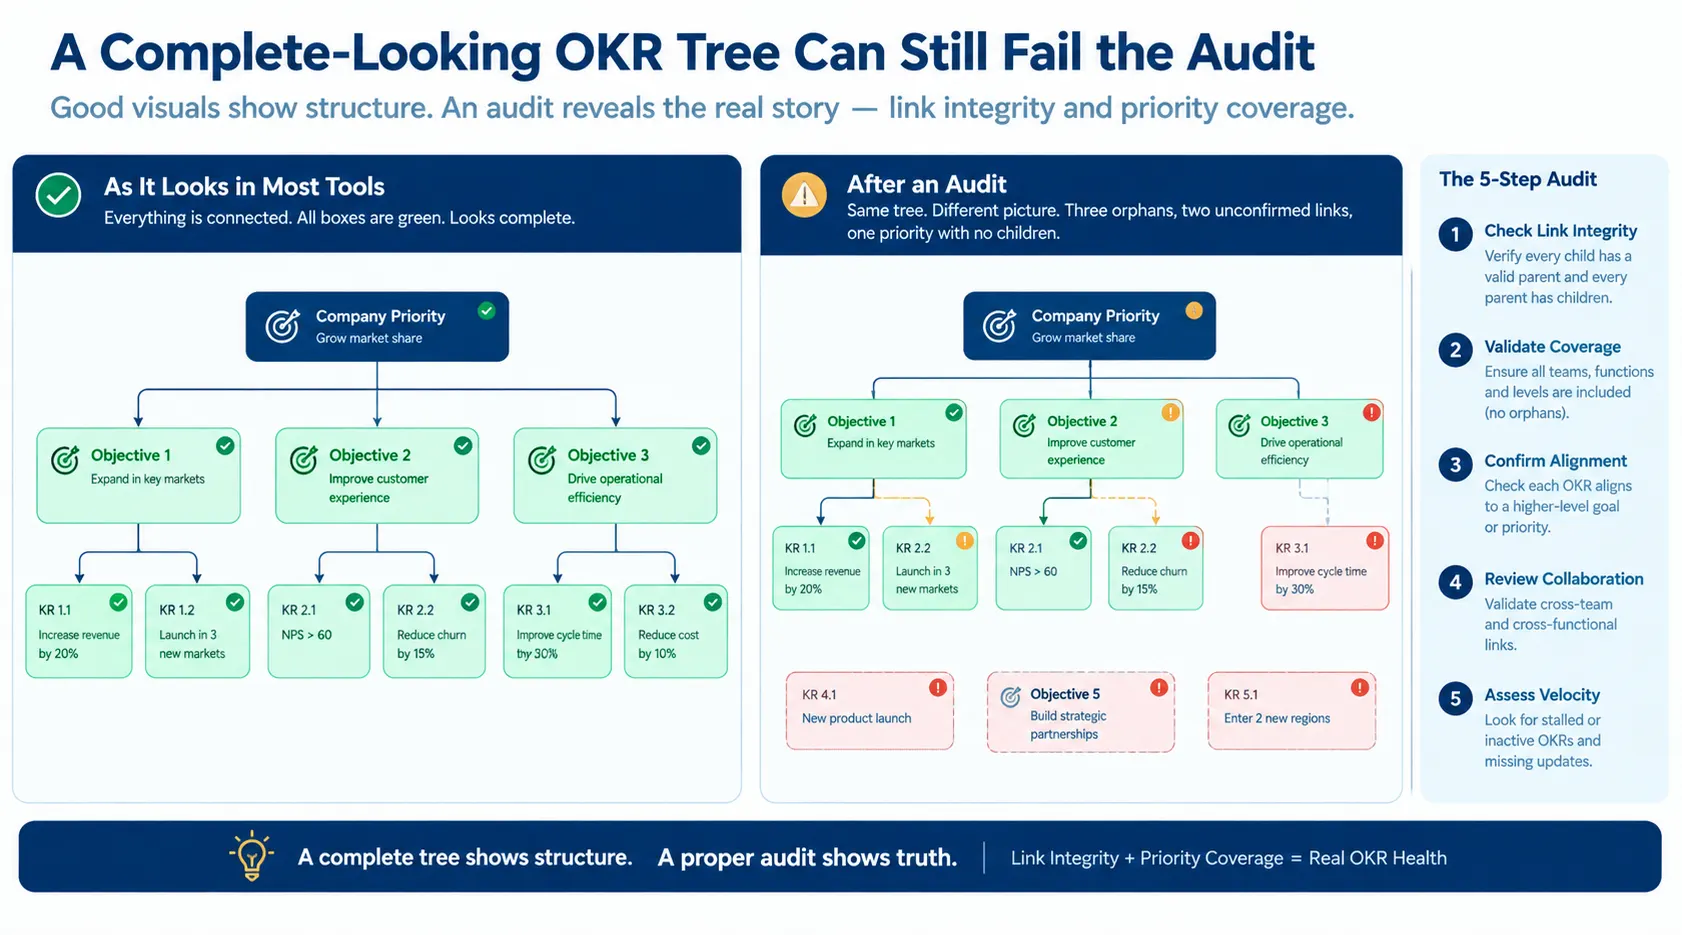
An OKR with no parent is an orphan. How to find orphan OKRs: filter your OKR tree for an empty parent field. Each one is among your disconnected team OKRs, real effort on something nobody above has claimed. If you want to see what a well-formed departmental goal looks like when it does connect, start there.
2. Link Integrity: the agreement test
Most strategic alignment metrics count links, not agreement. This component turns “Alignment = Agreement” into a number.
A link in a tool costs one click. A confirmed link requires a conversation. For each link in your sample, ask both owners one question: in one sentence, how does your key result move the one above it? If the child owner cannot answer, or the parent owner would not recognise the answer, the link is decorative.
On a small cascade, test every link. On a large one, sample 20%. A high coverage score with low link integrity is the signature of a cascade built to satisfy a template. That was the wall in the auditorium.
3. Priority Coverage: the strategic priorities alignment check
In an APAC retail company in aggressive expansion, I asked the CEO for his top three priorities so his leaders could start writing OKRs. In 45 minutes he could not define them clearly. Nobody had ever asked him to compress his vision into three outcomes an organisation could cascade from. A two-day war room followed before a single OKR was written.
Translating strategy into OKRs starts there. Count your company’s top priorities, usually two or three, and check how many have an owned key result at every level below. A priority with no downstream OKRs is a strategy nobody is executing. Test it against your real strategic priorities, not the list written for the board deck.
4. Dependency Resolution: horizontal alignment
For each OKR, ask teams to declare which other teams they need. Then check how many of those declared dependencies the other team has acknowledged with a key result of their own, or a co-owned one.
At a Middle East energy and utility group, six to eight senior leaders in the first room each had great individual thinking and no collective buy-in. Cross-functional dependency exercises were what turned individual agendas into a shared plan. Unacknowledged dependencies are where most cross-functional “alignment” quietly fails.
5. Cadence Signal: are the OKR check-ins real?
An OKR alignment score built on stale data photographs a cascade that has already moved. Measure the share of key results with a current check-in inside your review cycle, with honest status rather than permanent green. OKR progress tracking only works if the signal is current.
What the score does not tell you
The score measures structure and rhythm, not goal quality. Pair it with an OKR quality score and disciplined OKR scoring of every goal, which is what Define in our DEEP AI™ framework (Define, Execute, Evaluate, Plan) does at the point of writing. Without it, you can score 90 on a cascade of well-linked output goals that change nothing.
How to Calculate an OKR Alignment Score: A Worked Example
These are illustrative numbers, not client data. Take a company with 60 team OKRs, three company priorities, 15 declared dependencies and 180 key results.
| Component | Raw count | Rate | Weight | Points earned | Points lost |
|---|---|---|---|---|---|
| Line-of-Sight Coverage | 48 of 60 OKRs linked | 80.0% | 25 | 20.0 | 5.0 |
| Link Integrity | 30 of 48 links confirmed | 62.5% | 25 | 15.6 | 9.4 |
| Priority Coverage | 2 of 3 priorities covered | 66.7% | 20 | 13.3 | 6.7 |
| Dependency Resolution | 9 of 15 acknowledged | 60.0% | 15 | 9.0 | 6.0 |
| Cadence Signal | 126 of 180 KRs current | 70.0% | 15 | 10.5 | 4.5 |
| Total | 100 | 68.4 | 31.6 |
The final column is your alignment gap analysis. Points lost tell you where to act first. Here, link integrity loses the most (9.4 points), so the first intervention is not more cascading. It is sitting parent and child owners in a room.
Coverage alone would have told you 80% and a comfortable feeling. That is the trap.
To read the goal alignment score, use bands like these as a starting calibration:
| Score | Reading | What it means | First move |
|---|---|---|---|
| 85–100 | Aligned | Agreement exists and is being maintained | Review quarterly, protect the cadence |
| 70–84 | Leaking | Structure is sound, specific teams are drifting | Run the gap analysis on the lowest component |
| 50–69 | Display, not agreement | The tree looks complete but conversations have not happened | Stop adding OKRs. Run link integrity sessions |
| Below 50 | Broken cascade | Priorities or structure are the problem, not execution | Reset priorities and check org structure before cascading again |
The example above lands at 68: a cascade that exists on paper and has not yet been agreed in person.
One companion metric belongs beside this. The Execution Maturity Rate is the percentage of leaders who can independently write a genuine outcome-driven goal without coaching, a template or a quality review. In a typical first-cycle implementation it sits between 5% and 15%. In organisations running a well-coached program for 12 months, it reaches 30% to 40%. Treat it as your OKR maturity assessment. The health score tells you how the cascade is built; execution maturity tells you whether people can keep it healthy.
Your score shows how the cascade is built. Does your team have the capability to hold it?
Run the OKR execution maturity framework next to your cascade health score and see where capability, not structure, is the real gap.
How to Audit OKR Cascade: A Five-Step Alignment Gap Analysis
You can run this as an OKR health check in a week. It works as an OKR alignment audit checklist and as the skeleton of an OKR alignment spreadsheet.
- Export the tree. Pull every OKR with its owner, level and parent. This is your OKR hierarchy. Flag every orphan.
- List the priorities. Write the company’s two or three priorities at the top of a sheet, in the CEO’s own words. If you cannot get them, you have found your first problem.
- Check how OKRs align to company strategy. For each priority, trace every OKR that claims to support it down to the team level. Anything that supports no priority is either misaligned or the strategy is incomplete. This is how to check if OKRs are aligned to company strategy without trusting the tool.
- Sample the links. Hold 15-minute conversations with parent and child owners and record confirmed or not confirmed. This is how to measure alignment between company and team OKRs in a way a tool cannot fake.
- Count dependencies and check-ins. Tally declared and acknowledged dependencies, then current and stale check-ins by team.
Here is how to measure OKR alignment across departments: run the same five steps per department and compare. That is your OKR alignment scorecard: one row per team, five columns, one total. How to build an OKR alignment scorecard from scratch? That grid is the entire OKR alignment scorecard template, and an OKR cascade health check template needs nothing more.
Run the audit under clear OKR governance: one owner for the score, usually the strategy head’s office, published to leadership unedited. That is how you track OKR program health honestly. Owned by HR, the score becomes a compliance exercise. Owned by the CEO’s office, it becomes a strategy execution engine.
Why OKRs Fail to Cascade: Symptoms of a Broken Cascade
Most teams do not need a score to know something is off. They need to name it. These are the signs your OKRs are not aligned, the cascade breakdown patterns I see most often, and what to do first.
| Symptom | What it usually means | First fix |
|---|---|---|
| Team OKRs were written before company priorities were agreed | Low priority coverage. OKRs not linked to strategy because the strategy was never compressed | Pause the cascade. Take a week to agree on the 2–3 things that matter most |
| Every link exists in the tool, nobody can explain them | Low link integrity. Coverage is high, agreement is absent | Hold link conversations between parent and child owners |
| Key results are KPIs with new labels | Teams are reporting the present, not changing the future | Teach output versus outcome thinking with the team’s own goals |
| Two teams share a dependency, neither has a KR for it | Low dependency resolution | Give the dependency a co-owned key result |
| Check-ins are green until the final week | Low cadence signal, or fear of showing red | Make explicit that a missed stretch goal in cycle one is learning, not failure |
These misaligned OKRs symptoms explain why team OKRs don’t support company objectives. How to fix broken OKR cascade problems: priorities, then links, then dependencies, then rhythm. Do not reverse the order.
Recognised more than two symptoms in that table?
Our ebook walks through the common pitfalls of implementing OKRs and how to get out of each one before they harden into habit.
Achieve Your Goals Faster
See how Worxmate can help your team set clear goals and achieve faster results. Book your free demo today and experience the power of AI-driven OKRs in action.
How Often Should You Review OKR Alignment?
Different parts of the score move at different speeds, so the strategy review cadence should too.
- Weekly: cadence signal. Stale check-ins are the earliest warning.
- Monthly: a sampled link integrity pass and a dependency check.
- Quarterly: the full OKR alignment score, presented to the leadership team, followed by a retrospective that feeds the next cycle.
- Annually: re-weight the five components against what you learned, and re-test your annual goals against the priorities.
A quarterly rhythm is the minimum that lets the score work as an early signal rather than an autopsy.
OKR Alignment for Strategy Heads: Dashboard, Reporting and the Board
How strategy heads can measure OKR alignment without drowning in data: a strategy head OKR dashboard with three panels, not thirty. First, the score and its trend. Second, the five components as bars, so the weakest is obvious. Third, the five teams furthest from aligned. When people ask for OKR alignment dashboard examples, that is the sketch I draw, and it suits an OKR alignment dashboard for strategy teams of any size.
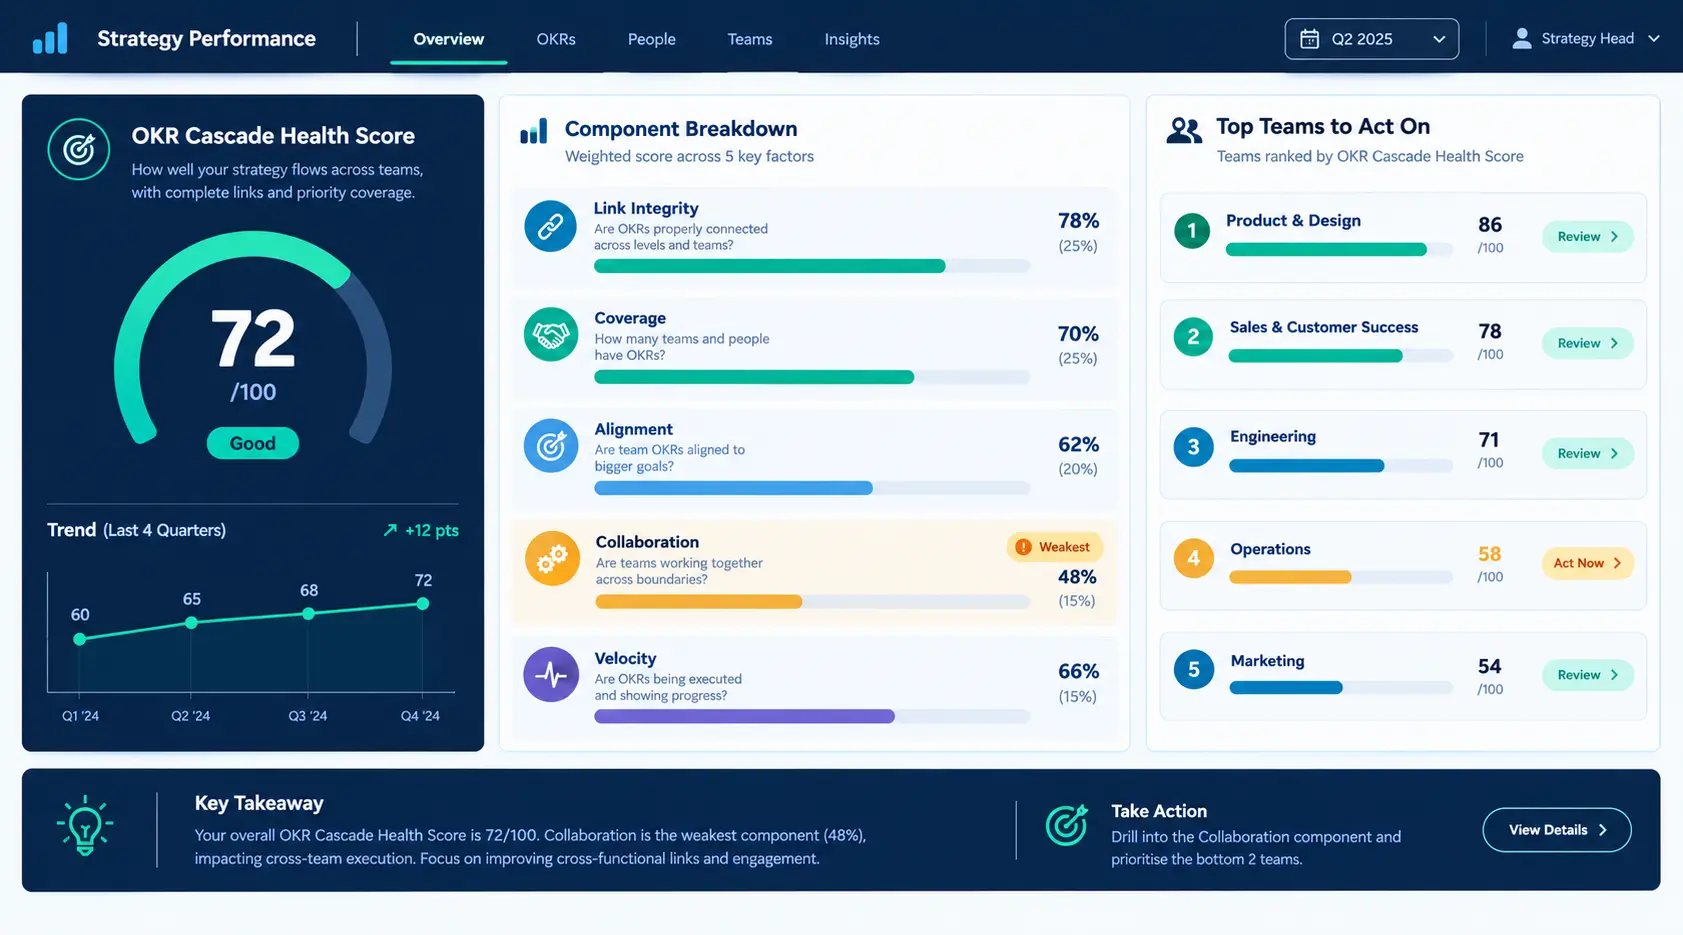
This is how CSOs track strategy execution through OKRs. Strategy execution measurement and strategy execution metrics are only credible if the strategy head puts a number on the line, so chief strategy officer OKRs should include the cascade health score as a key result.
When you present to the board, bring one page: the score, the trend, the two weakest components and the decision you need. An OKR alignment report for leadership team review follows the same shape. Good OKR reporting for leadership names the gap and what is being done about it. It does not decorate. This is how to present OKR alignment to the board without it turning into a debate about the tool.
Tooling. The right OKR software for alignment shows the cascade and the signals behind it, but the tool displays agreement; it does not create it. OKR tracking software and OKR scorecard software earn their place when they make the five measures cheap to compute. Still choosing a platform? Our comparison of the category covers that separately.
In our stack, OKR software holds the cascade and the Execute stage of DEEP AI™ handles check-ins and at-risk detection, which is what keeps cadence signal honest. Evaluate supports data-backed retrospectives and Plan carries what you learned into the next cycle. Around them, Axis AI shows where business performance is deviating from the plan, Orbit AI shows which leaders and managers need coaching support, and Nexus AI shows patterns across the whole organisation. Without them, the score is a spreadsheet exercise someone has to rebuild every quarter.
Measuring OKR Alignment in Large Organizations
Scale changes the method, not the logic. For OKR alignment for enterprises, compute the score per business unit, then roll up weighted by strategic importance. OKR alignment across business units hides the biggest gaps: each unit can score 80 and the group can still be misaligned.
OKR alignment in multi-division companies adds a fourth question: do the divisions agree on which two or three things matter most? In that Middle East energy group, the instinct was to bring in a big consulting firm for a four-to-eight-week SWOT. We redirected to a one-week agile brainstorm to agree on the two or three things that, if not done, would hurt business performance most. That is strategy execution alignment at group level: agreement first, cascade second.
In large cascades the middle layer decides everything. If coaching stopped at the C-suite, the program will not survive below it. Leadership goals only hold if managers can run the link conversations themselves.
Want an outside read on your score before the board sees it?
The organization performance audit gives you an independent view of where execution is leaking across teams and divisions.
Bottom Line: What I’d Tell a Strategy Head
Measure it, or stop saying you have it. Coverage will flatter you. Link integrity will humble you. Priority coverage will tell you whether you have a strategy at all.
Start with one cycle and a spreadsheet. Calculate the OKR cascade health score honestly, publish it unedited, and fix the lowest component first. In two cycles you will know more about your execution than a year of dashboards told you.
The software is the infrastructure. The coaching is the capability. You need both, and in the right order.
Path 1: the platform. If you are ready to see the cascade, check-ins and score in one place, explore Worxmate OKR software, look at pricing or book a demo.
Path 2: the consulting. If your score says the platform is not the first problem, our OKR consulting is built to take leaders from writing OKRs to running them.


Written by
An OKR Coach with 20+ years of implementation experience, Madhusudan has guided over 50 organisations through successful OKR transformations, training more than 500 leaders. Learn more about Worxmate.