 WORXMATE
How do you track OKR progress?
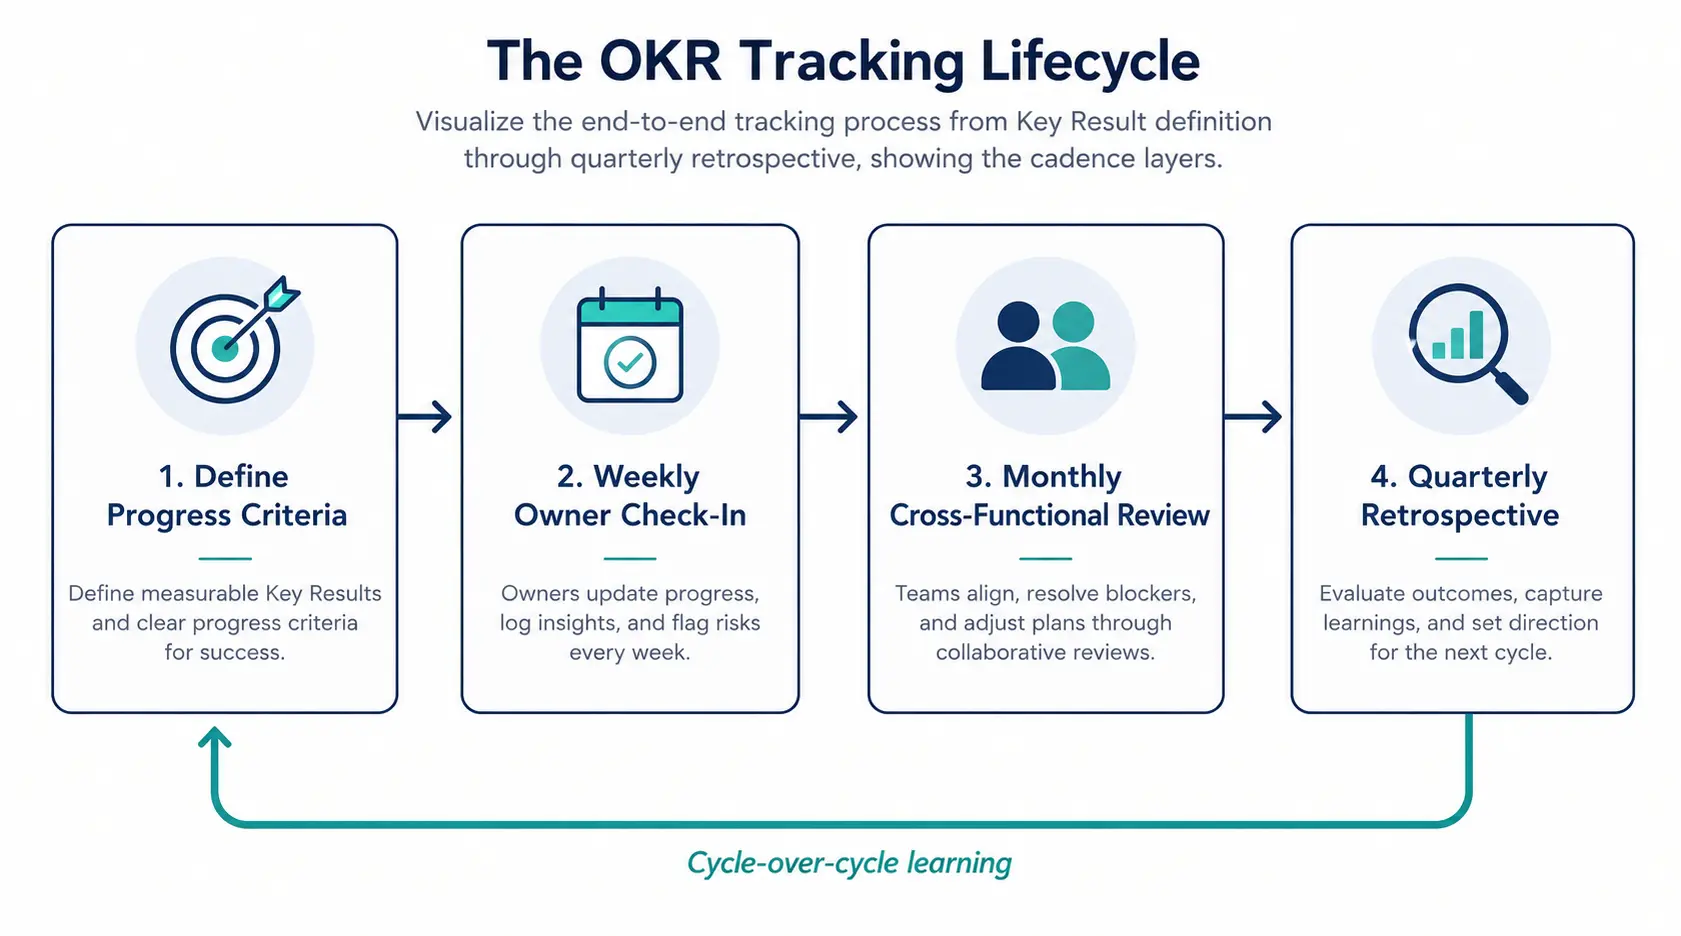
You measure it continuously, not just at quarter-end: define what “progress” means for each Key Result upfront, separate leading indicators (predictive) from lagging ones (retrospective), pick one scoring model confidence score or traffic-light and apply it consistently, then review it on a fixed cadence: weekly at the owner level, monthly across teams, quarterly with leadership. The biggest point of failure isn’t the tracking method it’s treating completion rate as success instead of tracking whether the goal actually moved the business.
Three weeks into an OKR rollout at a 70,000-person IT services organisation, I sat in a strategic business review with the leadership team reporting to the SBU Head. Same question came up, like it did in every meeting are we on track. Same result, every time people in the room with no real idea what was actually blocking progress, no visibility into the true state of execution, no way to connect what their teams were doing day-to-day to what the business actually needed from them.
That gap is the entire problem with OKR progress tracking. Not the framework. Not the ambition. The visibility.
Most organisations don’t fail at OKRs because they wrote bad goals. They fail because nobody can answer, with confidence, on any given Tuesday, whether those goals are actually moving. This guide is the tracking process I’ve built and rebuilt across 50+ implementations: what to measure, how often, who owns the number, and where it quietly falls apart.
What Is OKR Progress Tracking?
OKR progress tracking is the ongoing process of measuring, scoring, and reviewing how far Key Results have moved toward their target – through a defined cadence of check-ins, confidence or status scoring, and reporting layers that give teams and leadership an accurate, current picture of execution. It is not the same as writing OKRs, and it is not a one-time update at quarter-end. Done correctly, it answers one question continuously: is this outcome actually going to happen, and if not, what needs to change right now.
Tracking sits inside the Execute stage of a broader OKR cycle – after Objectives and Key Results are defined, and before they’re evaluated at cycle close. Google’s own Work guide to setting goals with OKRs makes the same point from the inside – the framework was never designed to end at goal setting; grading and review were built into it from the start. Tracking is the stage most OKR programs neglect, and the one that determines whether the program survives past its first quarter.
Why Most OKR Tracking Breaks Down Before Week Six
OKR tracking typically breaks down for three reasons: the tracking method has more friction than the team’s OKR literacy can absorb, updates become a compliance exercise instead of a real conversation, or the metrics being tracked are outputs dressed up as outcomes. All three are avoidable, and all three show up in the first few weeks – not months later.
The Spreadsheet Trap
Spreadsheets don’t fail because they’re low-tech. They fail because nobody owns the update discipline once the novelty wears off. I look for one signal in the first week of any engagement: how many product or process queries is the team raising per day. If it’s 15-20 queries a day in week one, adoption will break within a few weeks – not might break, will break. That volume tells you the tracking method has more friction than the team’s current OKR literacy can absorb. No amount of reminder emails fixes a mismatch between the tool and the team.
This isn’t just a coaching observation. Gallup’s most recent workplace research found that clarity of expectations at work has fallen sharply over the past several years – fewer than half of employees now say they clearly know what’s expected of them. Tracking built on unclear expectations doesn’t fail because the tool is wrong. It fails because there was never a shared definition of “done” to track against.
The Set-and-Forget Trap
Teams write ambitious OKRs in week one, then don’t revisit the scoring logic until the quarter is nearly over. By then, the update is retrospective fiction – everyone reconstructs what “probably” happened rather than tracking what actually did.
The Vanity-Metric Trap
This is the one that looks like tracking but isn’t. A team hits 80% of its Key Results and still produces no material change in the business, because the KRs measured activity, not outcome. Goal completion rate is the most visible tracking metric and the least meaningful one. The metric that actually tells you whether a program is working is what I call the Execution Maturity Rate – the percentage of leaders who can independently write and track a genuine outcome-driven goal without coaching support, without a template, without a quality review. In a typical first-cycle implementation, that number sits between 5% and 15%. In organisations that track and coach consistently over 12 months, it reaches 30% to 40%.
“Goal completion rate is the most visible tracking metric and the least meaningful one. Track the Execution Maturity Rate instead – it tells you whether the program is actually working, not just whether boxes got checked.”
The Step-by-Step OKR Tracking Framework
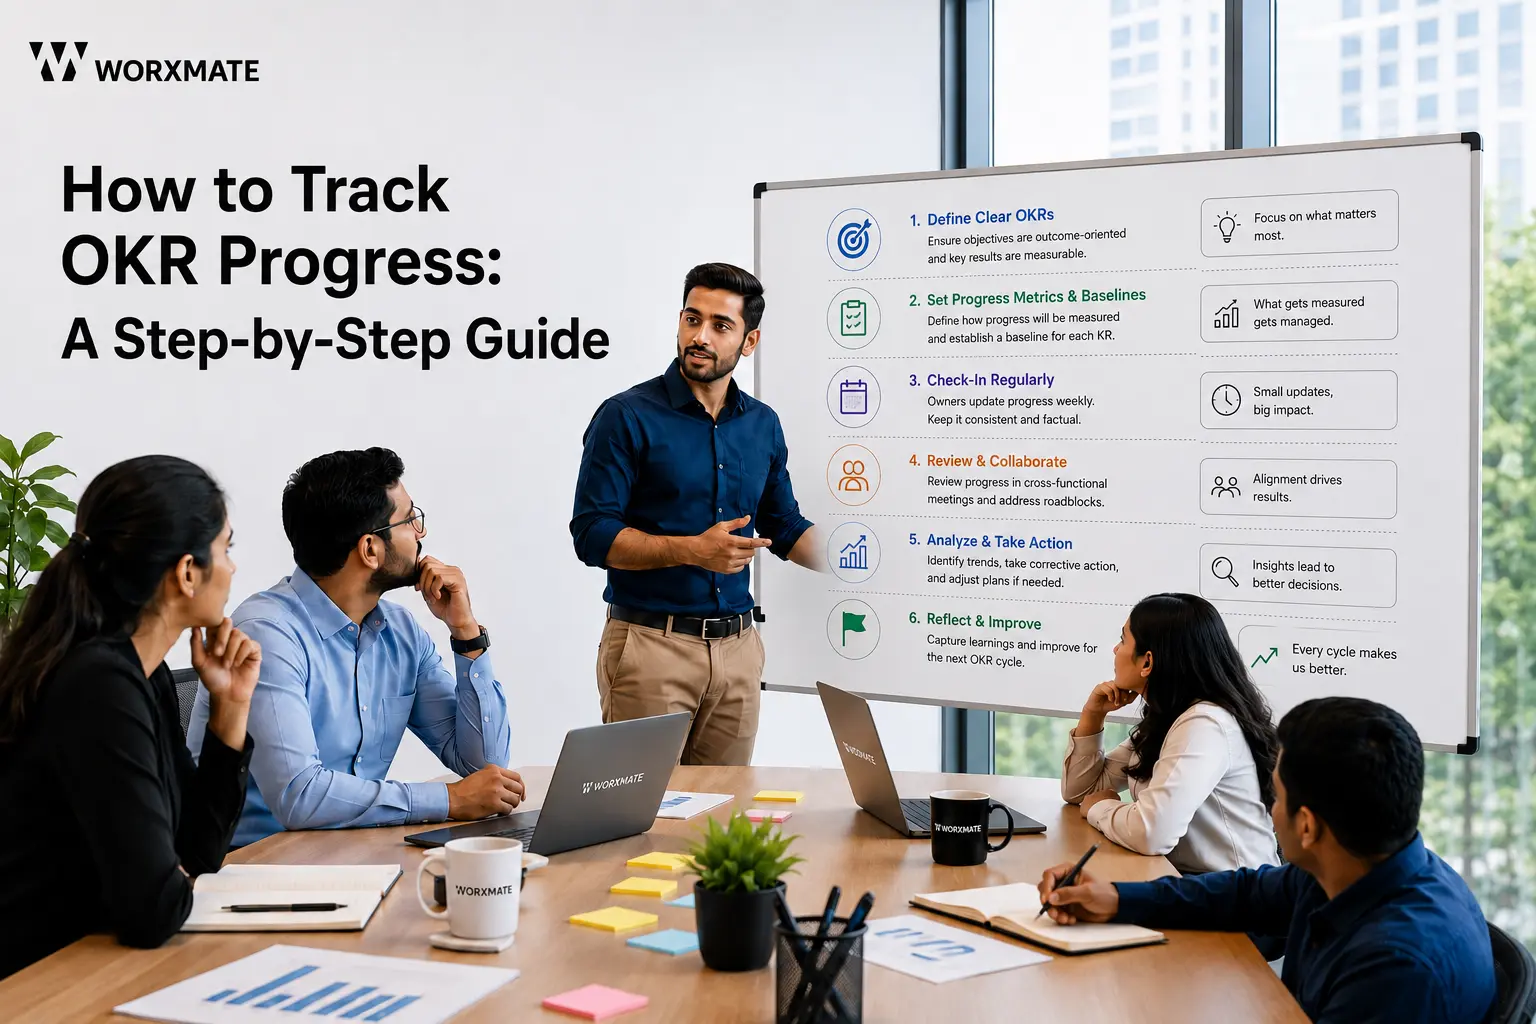
Tracking OKR progress effectively requires six sequential steps: defining what progress means before you measure it, separating leading from lagging indicators, choosing a scoring model, setting a fixed check-in cadence, building a layered reporting structure, and running a mid-cycle health check. Skipping any one of these is where most tracking processes quietly fail.
Step 1: Define What “Progress” Actually Means Before You Track It
Before anyone opens a dashboard, agree on what “50% progress” means for each Key Result. Is it 50% of a numeric target reached? 50% of the milestones complete? 50% confidence the outcome will land by quarter-end? These are three different measurement systems, and teams that skip this step end up with a dashboard full of numbers that mean different things depending on who entered them. This is also where writing genuinely measurable goals up front pays off – a Key Result that was ambiguous when it was written stays ambiguous no matter how good the tracking tool is.
Step 2: Separate Leading Indicators from Lagging Indicators
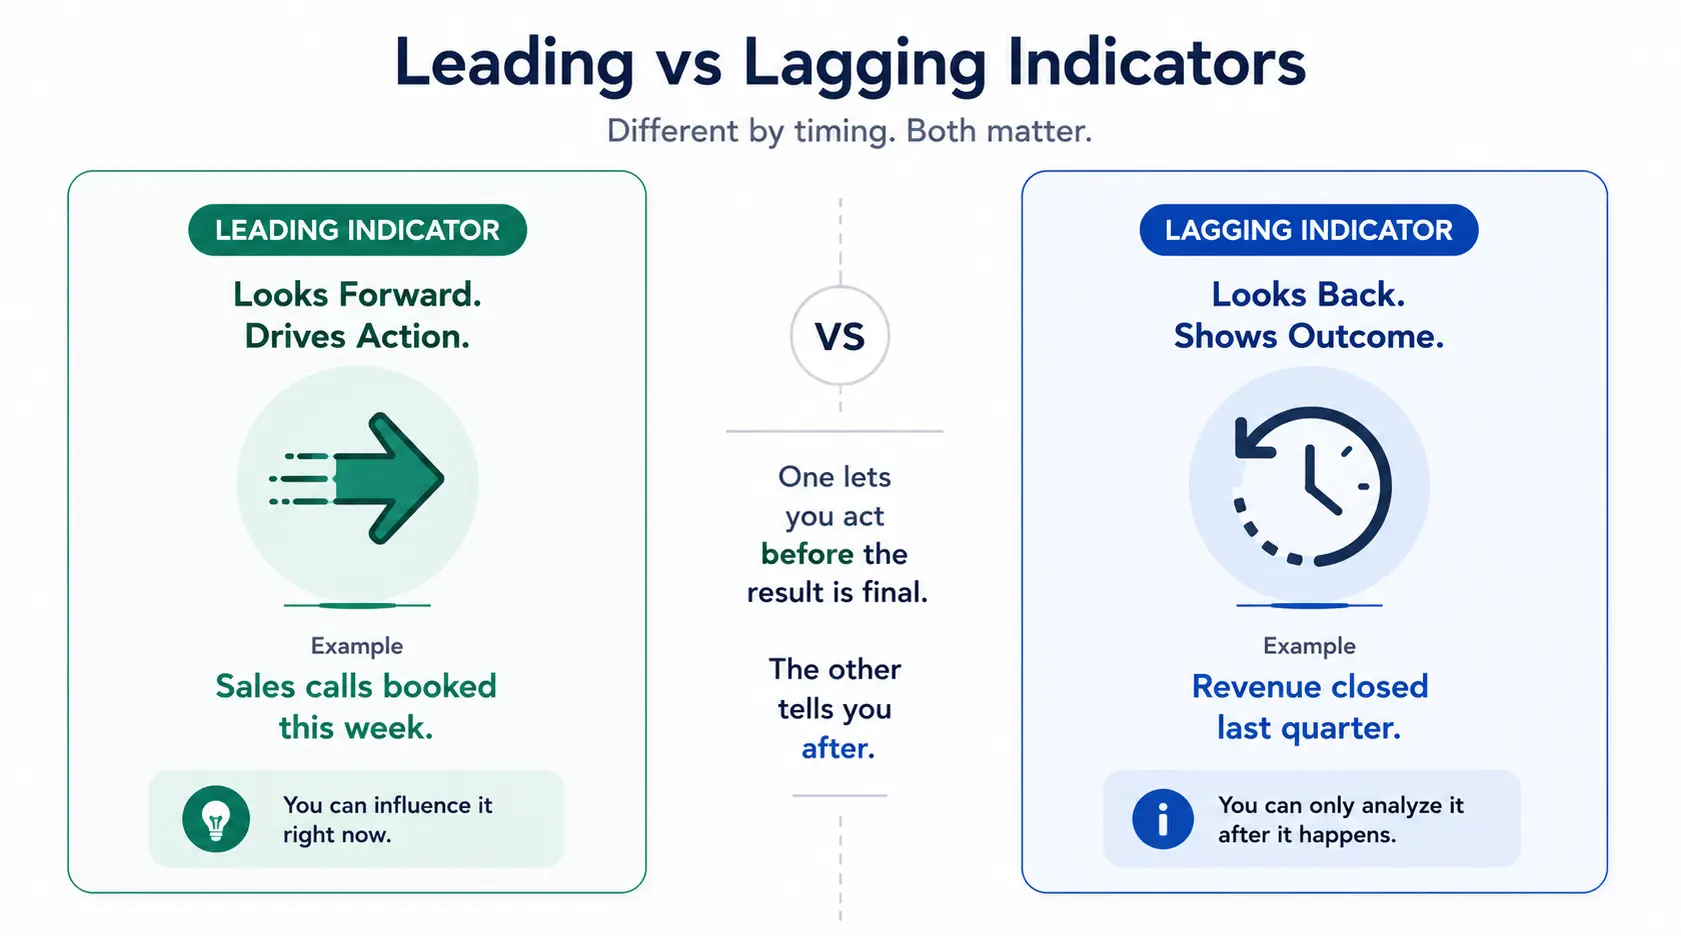
Leading indicators predict future outcomes and can be acted on before the result is final; lagging indicators report what already happened and cannot be changed once measured. Most industrial and engineering leaders’ default to lagging indicators because that’s what their performance systems have always measured – “here is our current performance” instead of “here is what needs to change to drive growth.” I saw this directly with a multi-billion-dollar mining and engineering group: the shift that changed how their leadership team operated wasn’t a new tool, it was making visible the chain from a ground-level daily leading indicator to a regional expansion outcome. Once leaders could see that chain, they stopped waiting for quarter-end numbers to tell them something had gone wrong.
Step 3: Choose a Scoring Model (Confidence Score vs Traffic-Light)
Pick one model and apply it consistently. Mixing models across teams is how executive dashboards become unreadable. See the comparison below.
Step 4: Set a Non-Negotiable Check-In Cadence
- Weekly Check-Ins
Owner-level. Five to ten minutes per Key Result. Update the score, flag blockers, note what changed since last week. This is not a status meeting it’s a data entry discipline backed by a thirty-second conversation if the score moved.
- Monthly Reviews
Manager and cross-functional level. This is where dependencies surface the Key Result that’s stalled because a different team hasn’t delivered an input it depends on. Monthly is the right cadence to catch this before it becomes a quarter-end surprise. Harvard Business Review’s guidance on team-level OKRs makes a related point worth carrying into this review: OKRs work best tracked as team commitments, not individual assignments, which is exactly the level at which cross-functional dependencies actually get resolved.
- Quarterly Retrospectives
Leadership level. Not a scoring exercise a genuine retrospective. What moved, what didn’t, why, and what that means for how the next cycle gets planned. One completed OKR, honestly tracked and retrospected, is worth more than five that were written and never seriously revisited.
Step 5: Build the Reporting Layer (Manager, Cross-Functional, Executive)
Tracking data has to be shaped differently at each layer. A manager needs KR-level detail. A cross-functional lead needs dependency visibility. An executive needs a portfolio view – which leadership-level objectives are healthy, which are at risk, and why, in under two minutes of reading. Building one dashboard and expecting it to serve all three audiences is a common design mistake.
Step 6: Run a Mid-Cycle OKR Health Check
Halfway through the cycle, stop and ask which OKRs are genuinely on track, which are at risk, and which are quietly dead, but nobody has said so out loud. This is where real-time visibility matters most teams relying on manual, end-of-week updates typically discover at-risk goals two to three weeks later than teams working from live data. If you want the full breakdown of what real-time OKR tracking changes about this step specifically, I’ve written about it separately.
What Metrics Actually Matter in OKR Tracking
The metrics that matter most in OKR tracking are leading indicators (which predict outcomes early), confidence scores (which capture the owner’s honest read on delivery likelihood), and traffic-light status (which makes risk scannable at a glance) not raw completion percentages, which measure activity rather than outcome. For a deeper breakdown of which metrics to prioritise by team type, see our full guide to OKR tracking metrics. Dedicated goal-tracking software is now its own recognised category Gartner tracks employee performance and goal management systems as a distinct market separate from general HR platforms, which is itself a signal of how specialised this measurement problem has become.
Leading vs Lagging Indicators
| Indicator Type | What It Tells You | Example | When It’s Useful |
| Leading | What’s likely to happen, in time to act | Sales calls booked this week | Mid-cycle course correction |
| Lagging | What already happened | Revenue closed last quarter | Cycle-end evaluation |
| Leading | Feature adoption rate in first 7 days | Product usage trend | Early risk detection |
| Lagging | Customer churn rate | Retention outcome | Confirming impact after the fact |
Confidence Scoring Explained
The Key Result owner rates their honest belief that the outcome will be hit typically on a 1–10 or red/amber/green-equivalent scale, updated weekly. It’s fast, and it surfaces problems the owner sees but hasn’t escalated yet. Its weakness: it’s only as honest as the culture allows, which is why fear of missing a stretch goal has to be addressed directly and early, not left as an unspoken risk in every check-in. Google’s own Work documentation uses a related numeric model grading each Key Result on a 0 to 1.0 scale, with 0.6-0.7 treated as the healthy target for a genuinely stretch goal, not 1.0.
Traffic-Light Scoring Explained
Red, amber, green mapped to a numeric threshold (e.g. green = 70%+ of target trajectory, amber = 40-69%, red = below 40%). It’s the fastest format for executive scanning and the easiest to misuse if the thresholds aren’t calibrated per Key Result type.
Confidence Scoring vs Traffic-Light Scoring
| Factor | Confidence Score | Traffic-Light |
| Speed to update | Fast | Fastest |
| Executive readability | Requires context | Instant |
| Captures owner intuition | Yes | Limited |
| Risk of gaming | Moderate (self-reported) | Lower if system-calculated |
| Best paired with | Weekly owner check-ins | Executive dashboards |
OKR Tracking in Practice — Enterprise, Startup, and Remote Teams
Tracking discipline has to flex by organisational context: enterprise teams need cross-functional dependency visibility, startups need speed without process overhead, and remote teams need tracking that replaces the hallway conversation they don’t have. The mechanics stay the same cadence, scoring, reporting but what breaks first is different in each setting.
Enterprise Scenario
In large organisations, the failure mode is almost never lack of tracking activity – it’s fragmented strategy implementation and monitoring that never rolls up. Different business units score differently, update on different days, and use different definitions of “on track.” McKinsey’s research on strategy execution has found that roughly half of executives don’t believe their organisation effectively links budgets and resourcing to stated strategic priorities — which is a resourcing version of exactly the tracking fragmentation problem I see in OKR programs. At a 70,000-person IT services organisation I worked with, the fix wasn’t a new tool – it was a shared thinking process: every leader learned to distinguish output from outcome using real scenarios from their own business, so that by the time tracking started, everyone was scoring against the same definition of progress.
Startup Scenario
At a roughly 100-person European fintech, the tracking problem showed up as KPI-led goals that generated plenty of data and no clarity. The fix was cross-functional co-ownership of a single Key Result between the Product Lead and an Account Executive jointly accountable for the same number. That single structural change made tracking meaningful, because for the first time, two functions had to reconcile their view of progress instead of reporting separately. This is goal alignment working as a tracking mechanism, not just a planning exercise.
Remote and Distributed Team Scenario
Remote teams lose the informal signal that a co-located team gets for free the hallway comment that a project is slipping, three days before it shows up in any report. Tracking has to be more deliberate and more frequent in a distributed setting, not less. We go deeper on the specific cadence and tooling adjustments in our guide to OKR tracking for remote teams.
Manual Tracking vs AI-Assisted Tracking
Manual OKR tracking works when teams are small, OKR literacy is high, and update discipline is culturally strong; it breaks down at scale because status-chasing, stale data, and delayed at-risk detection compound faster than any manager can manually correct for. AI-assisted tracking doesn’t replace the check-in it removes the lag between something going wrong and someone finding out.
Where Spreadsheets Still Work
Small teams, early-stage programs, high trust, low headcount. If you can reasonably expect every KR owner to update honestly without a system nudging them, a spreadsheet is a legitimate starting point.
Where AI-Assisted Tracking Changes the Outcome
At any meaningful scale, the value isn’t automation for its own sake it’s earlier detection. A platform that flags an at-risk Key Result the moment its trajectory slips, rather than the moment someone remembers to check, closes the two-to-three-week detection gap that manual tracking almost always has. This is the core of the Execute stage in our DEEP AI framework automated check-ins and at-risk detection that surface a problem while there’s still time to act on it, not after the quarter has closed around it, inside a purpose-built OKR software layer rather than a general HR system.
This gap between what AI makes possible and what organisations actually do with it is not unique to OKR tracking. Microsoft’s 2026 Work Trend Index found that only about a quarter of AI users say their leadership is clearly and consistently aligned on how AI should be used the tool gets adopted faster than the organisation redesigns how it works around it. The same pattern shows up in OKR tracking software: teams buy the platform, then keep running the old manual cadence inside it.
Manual vs Automated Tracking
| Factor | Manual (Spreadsheet) | AI-Assisted (Platform) |
| Update effort | High, manual entry | Low, guided prompts |
| At-risk detection speed | Days to weeks | Real time |
| Cross-team roll-up | Manual reconciliation | Automatic |
| Executive dashboard | Rebuilt each cycle | Live, always current |
| Best for | Small teams, early programs | Scaling teams, multi-BU orgs |
Executive Reporting – What Leadership Actually Wants to See
Executives want a portfolio-level view of OKR health in under two minutes: which objectives are on track, which are at risk and why, and what decision or resource is needed from them – not a full list of every Key Result at every score. Real-time OKR dashboards exist specifically to solve this compression problem; without one, someone spends hours before every leadership meeting manually rebuilding a status view that’s already stale by the time it’s presented.
Trust is part of why this compression matters. Deloitte’s 2025 Global Human Capital Trends research found that most managers and most workers don’t trust their organisation’s performance management process – a reporting layer that looks precise but isn’t grounded in a consistent scoring model is one of the reasons why.
Executive Reporting Checklist
| Include | Exclude |
| Objective-level status (on track / at risk / off track) | Every KR’s raw percentage |
| One-line reason for any at-risk objective | Full check-in history |
| Cross-functional dependencies blocking progress | Team-level task lists |
| The specific decision or resource needed | Activity metrics with no outcome link |
Common OKR Tracking Mistakes (And What to Do Instead)
The most common OKR tracking mistakes are inconsistent scoring across teams, treating check-ins as a status report instead of a conversation, letting HR own the tracking process alone, and confusing goal completion with genuine progress. Each one is fixable once it’s named.
Common Mistakes vs What to Do Instead
| Mistake | What to Do Instead |
| Different teams use different scoring definitions | Standardise the model (confidence or traffic-light) before cycle start |
| Check-ins become status reports read aloud | Make check-ins conversations about blockers, not recitations of numbers |
| HR owns tracking alone | Anchor ownership in the CEO’s office; HR supports adoption, doesn’t drive it |
| Completion rate treated as success | Track Execution Maturity Rate alongside completion |
| Tracking stops at the C-suite | Extend coaching and tracking discipline to the middle-management layer, where programs actually live or die |
| Fear of missing a stretch goal goes unaddressed | State explicitly, from cycle one, that missing a stretch goal is learning, not failure |
When HR drives tracking alone, the rest of the leadership team treats it as one more performance-assessment exercise rather than a strategy execution discipline. OKRs tracked by the CEO’s office become a genuine execution engine. Ownership determines the outcome before a single check-in happens.
None of this is unique to any one organisation. Harvard Business School’s primer on OKRs makes a similar observation: the framework itself is simple to explain and consistently difficult to sustain past the first cycle.
The failure mode I see most often and the one the consulting industry rarely names, because it implicates the standard engagement model is coaching that stops at the C-suite. The program then dies below the leadership layer within a quarter, because the middle-management layer, where check-ins actually happen, was never equipped to run them.
Key Takeaways
- OKR progress tracking is a continuous cadence, not a quarter-end update.
- Separate leading indicators (predictive) from lagging indicators (retrospective) most tracking failures come from over-relying on lagging data.
- Pick one scoring model confidence score or traffic-light and apply it consistently across every team.
- Weekly owner check-ins, monthly cross-functional reviews, and quarterly retrospectives are the minimum viable cadence.
- Executives need a two-minute portfolio view, not a full Key Result breakdown.
- Goal completion rate is not the success metric. Execution Maturity Rate is.
- Tracking discipline has to extend below the C-suite, or the program dies within a quarter.
- AI-assisted tracking’s real value is closing the detection gap on at-risk goals, not automation for its own sake.
Implementation Checklist
- Define what “progress” means for every Key Result before tracking begins
- Identify at least one leading indicator per Key Result
- Choose one scoring model and apply it org-wide
- Set and communicate the weekly / monthly / quarterly cadence
- Build separate reporting views for manager, cross-functional, and executive audiences
- Schedule a mid-cycle OKR health check at the calendar’s midpoint
- Name the ownership of the tracking process explicitly (CEO’s office, not HR alone)
- Address fear of failure directly in the first tracking cycle, not after it surfaces
- Extend coaching and tracking discipline below the leadership layer
- Review the Execution Maturity Rate alongside completion rate at cycle close
Conclusion: The Software Is the Infrastructure. The Coaching Is the Capability.
Tracking OKR progress isn’t a tooling decision. It’s a discipline decision that a tool can make easier or harder, never one it can substitute for. The dashboard doesn’t create the honesty in a confidence score. The cadence doesn’t create itself just because it’s on a calendar. Those come from an organisation that has decided tracking matters as much as goal setting did and that’s a leadership decision before it’s a product decision.
If your team is ready to move from spreadsheets to real-time visibility automated check-ins, at-risk detection, and executive dashboards that don’t need rebuilding before every leadership meeting see the platform and what the Execute stage of tracking looks like inside it.
If tracking keeps breaking down for reasons a dashboard won’t fix inconsistent scoring, coaching that stops at the C-suite, fear of missing a stretch goal that nobody’s named out loud that’s a capability gap, not a software gap. OKR coaching closes that gap directly, the way it has across 50+ implementations.
The software is the infrastructure. The coaching is the capability. Most organisations that stall have invested heavily in one and skipped the other.


Written by
An OKR Coach with 20+ years of implementation experience, Madhusudan has guided over 50 organisations through successful OKR transformations, training more than 500 leaders. Learn more about Worxmate.