 WORXMATE
Quick Answer
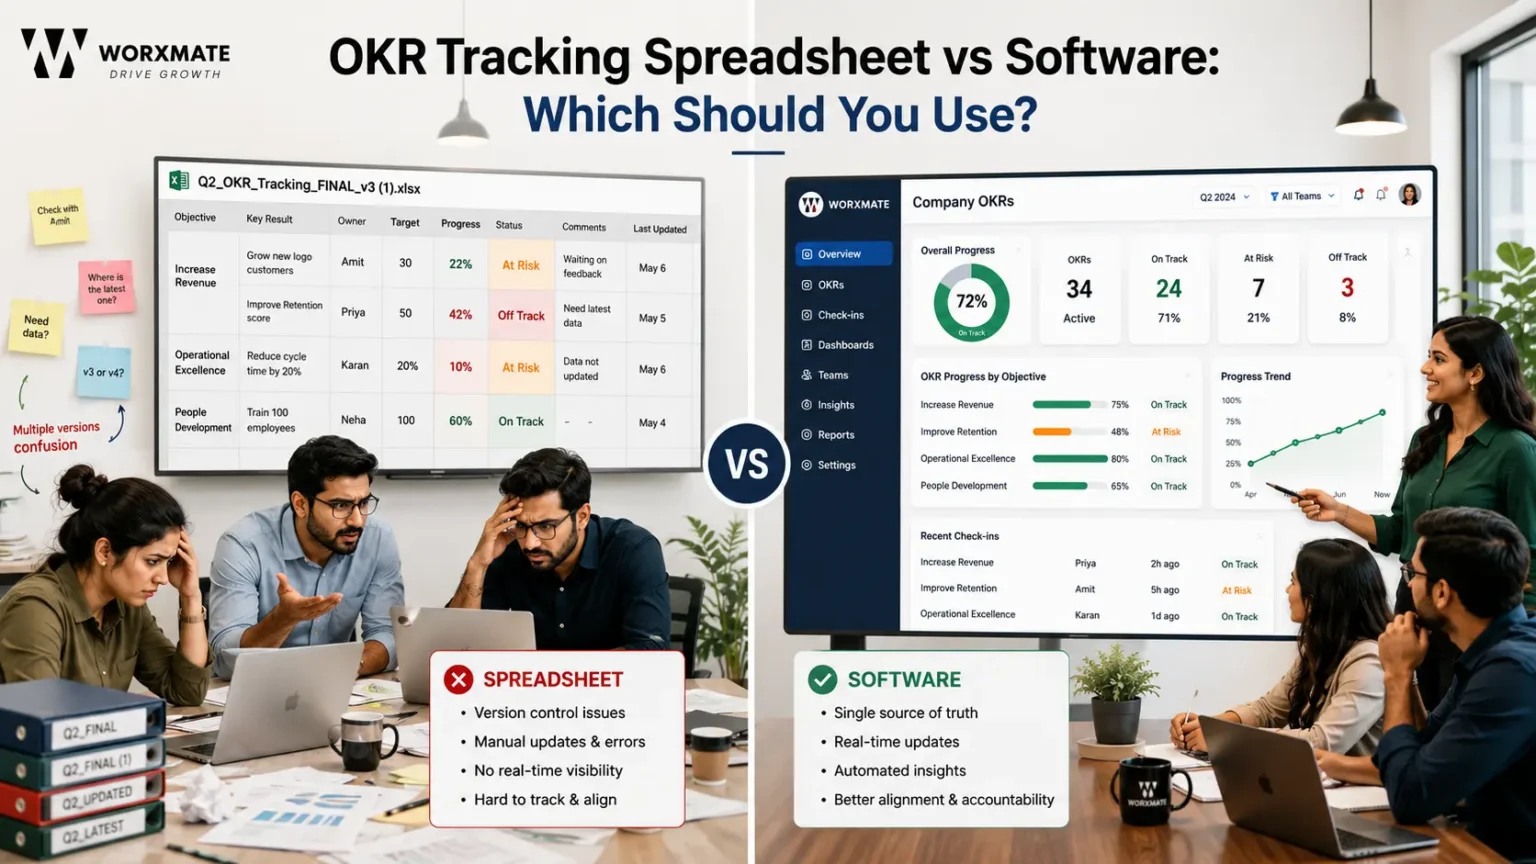
An OKR tracking spreadsheet works well for small teams starting their OKR journey. As teams grow, dedicated OKR software becomes essential for real-time visibility, automation, cross-functional alignment, and reliable progress tracking. The right choice depends on your organization’s size, complexity, and execution maturity—not just the tool itself.
Every OKR program I have coached starts the same way. A leadership team gets excited, someone builds a clean OKR tracking spreadsheet with columns for Objective, Key Result, Owner, and Status, and for exactly one quarter it works. By week six of quarter two, someone is asking, “wait, is this the version from Tuesday or the one Priya sent Thursday?” That question is not a tooling problem. It is the first symptom of an OKR tracking system that was never designed to survive a live business.
The question I get asked most often at Worxmate is not “which OKR software is best.” It is narrower and more honest: “Can we just keep using our spreadsheet a little longer?” The answer depends on things most people never ask about their own organisation before making the call.
Why This Isn’t Really a Tooling Question?
I have spent 20+ years in strategy execution and 10+ years specifically implementing OKRs across 50+ organisations: enterprise, SMB, and startup, across pharma, fintech, manufacturing, retail, IT services, and energy. In almost every one of those engagements, the spreadsheet-versus-software decision came up. Almost none of those conversations were actually about the tool. They were about whether the organisation had the discipline, the cadence, and the visibility into strategic priorities to make either option work.
That distinction matters, because most content on this topic tells you spreadsheets are bad and software is good. That is lazy advice. A 12-person founding team with one shared priority list does not need a platform. A 400-person company running quarterly cycles across six departments cannot survive on one OKR tracking spreadsheet shared over email. The real skill is knowing which stage you are in and knowing the signs that you have already outgrown it.
If you’re still grounding your team in what an OKR actually is before you pick a tracking method, our full breakdown of Objectives and Key Results is worth reading first. Tooling decisions made before the framework is understood almost always get reversed within two quarters.
What an OKR Tracking Spreadsheet Actually Gets Right?
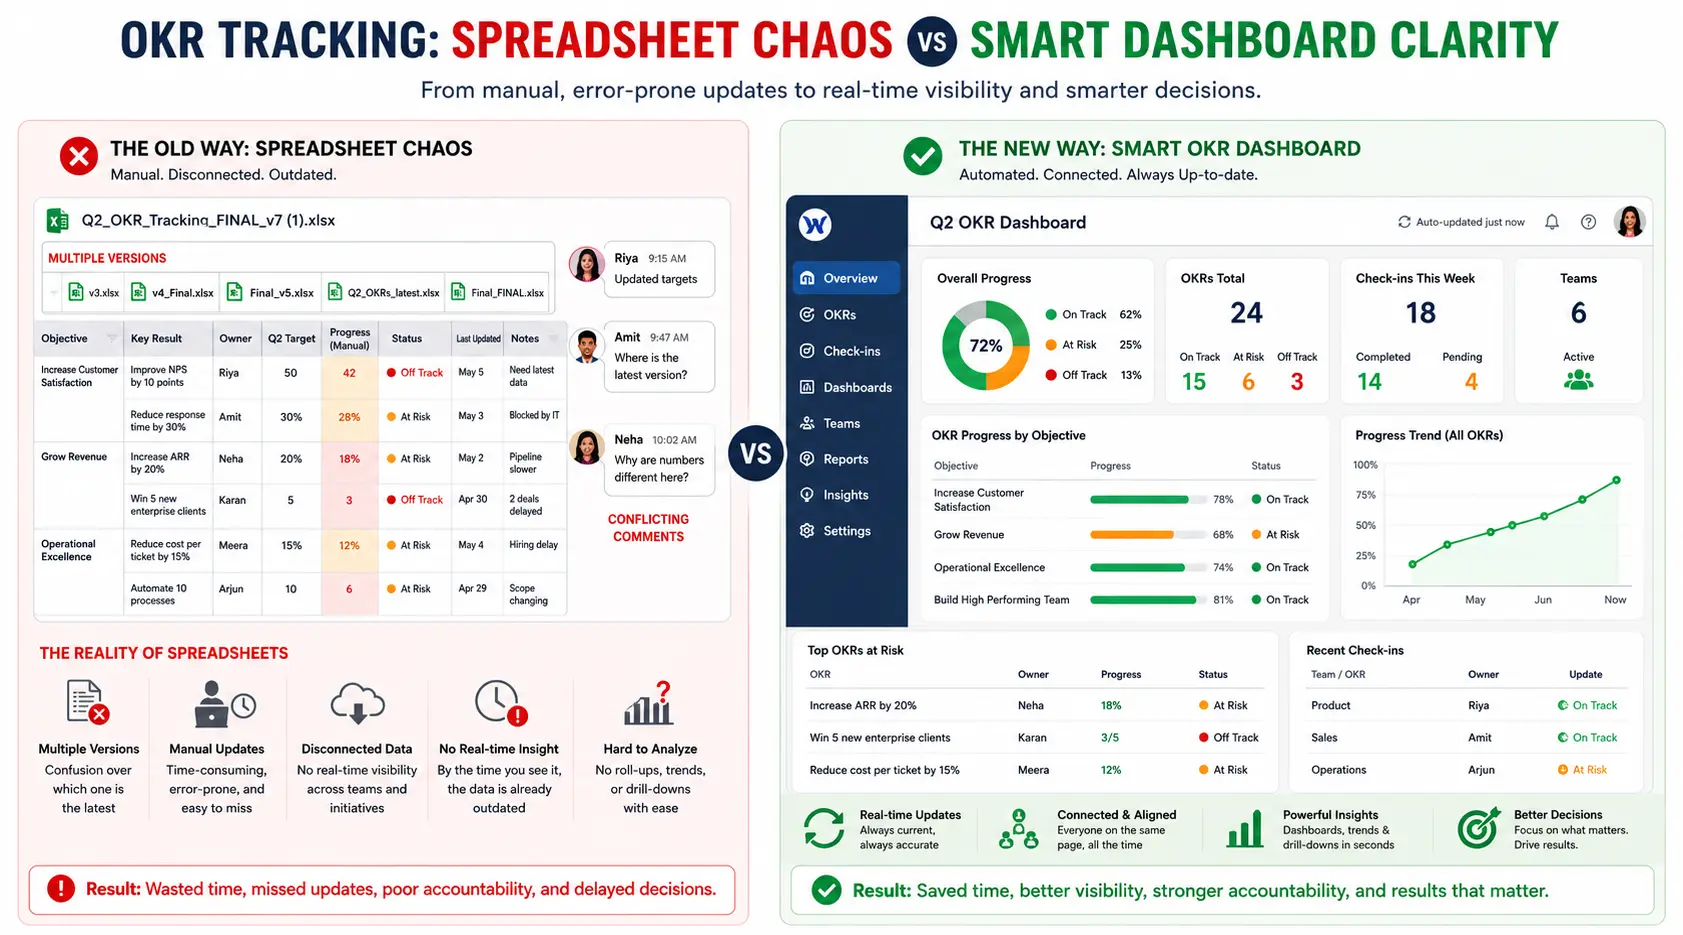
Before I list where spreadsheets break, credit where it’s due. A spreadsheet is genuinely the right tool in three specific situations, and pretending otherwise just pushes teams toward software they aren’t ready to use well.
It keeps the exercise collaborative and low-stakes. In the first cycle of an OKR program, the goal is to teach a leadership team to think in outcomes instead of outputs not to give them a polished system. A shared document, edited together in real time on a call, is often the better teaching tool precisely because it’s unglamorous.
It costs nothing while you’re still validating the framework. If you’re not certain OKRs are the right operating rhythm for connecting your strategic goals to daily work yet, buying software before running even one honest cycle is putting infrastructure ahead of conviction.
It’s fast to stand up. No procurement cycle, no onboarding, no integration mapping. For a single team of roughly 15 people or fewer working toward a handful of annual goals, that speed usually outweighs anything a platform offers.
Where it stops being the right answer is the moment your OKR progress tracking needs to survive more than one team’s attention span and that moment arrives faster than most leaders expect.
Where an OKR Tracking Spreadsheet Breaks Down?
I covered the visible symptoms version control chaos, the “OKR nag” cycle of managers chasing updates, delayed intervention in our deep dive on real-time OKR tracking. What I want to name here is the failure mode underneath all of those symptoms, because it’s the one that determines whether switching to software will actually fix anything.
Phantom precision. A cell that says “73% complete” looks exact. It is not. It carries no confidence signal, no historical trail of why the number moved, and no distinction between a Key Result that is genuinely on track and one where the owner just typed in a number that felt safe to report. I have sat in enough quarterly reviews to know that a spreadsheet number is often a negotiated number, not a measured one.
The silent editor problem. Somebody always “cleans up” the sheet before the leadership review. Rows get deleted, formulas get overwritten, colours get changed to look more optimistic. None of this is malicious it’s what happens when a document has no audit trail and a human owns the narrative instead of the data owning it.
No connective tissue to actual work. A spreadsheet lives next to the work, never inside it. Someone closes a deal in the CRM or ships a feature in Jira, and none of that updates the tracker automatically. The person responsible has to remember to go and update a second, disconnected system and remembering is exactly the kind of discretionary effort that disappears the moment strategy implementation gets busy.
This is the pattern I see consistently across implementations: organisations don’t fail at OKR tracking because they picked the wrong software. They fail because their tracking system has no mechanism for telling the truth automatically. A spreadsheet can be disciplined into telling the truth for a while. It cannot be built to tell the truth by default.
A Word on Why Teams Confuse the Tool With the Real Problem
Here’s a pattern that makes the spreadsheet-versus-software debate messier than it should be: teams are often tracking KPIs and calling them OKRs, and no tool fixes that confusion on its own.
I saw this clearly with a multi-billion-dollar mining and engineering group I worked with across their Middle East and Europe division. The business wasn’t struggling it was growing but new entrants were eating into market share and nobody had connected daily execution to the threat. The breakthrough wasn’t a dashboard. It was the leadership team finally distinguishing between three things they’d been treating as one: Objectives (directional clarity on where the business needs to go), Outcomes (what actually needs to change to get there), and KPIs (lagging indicators that tell you where you stand today, not where you’re heading).
If your organisation is still tracking KPIs and labelling them Key Results, moving that confusion into expensive software doesn’t resolve it just makes the confusion look more official. Get honest about what you’re actually tracking before you evaluate OKR tracking tools. Our breakdown of how live OKR dashboards separate leading indicators from lagging ones walks through exactly how to tell the difference, and our guide to measurable goals covers how to write a Key Result that can’t quietly turn into a KPI.
The software is the infrastructure. The coaching is the capability. You need both — and in the right order.
The Decision Framework: Spreadsheet, Software, or Neither Yet?
Here’s the framework I actually use with clients, instead of a blanket “always upgrade” recommendation.
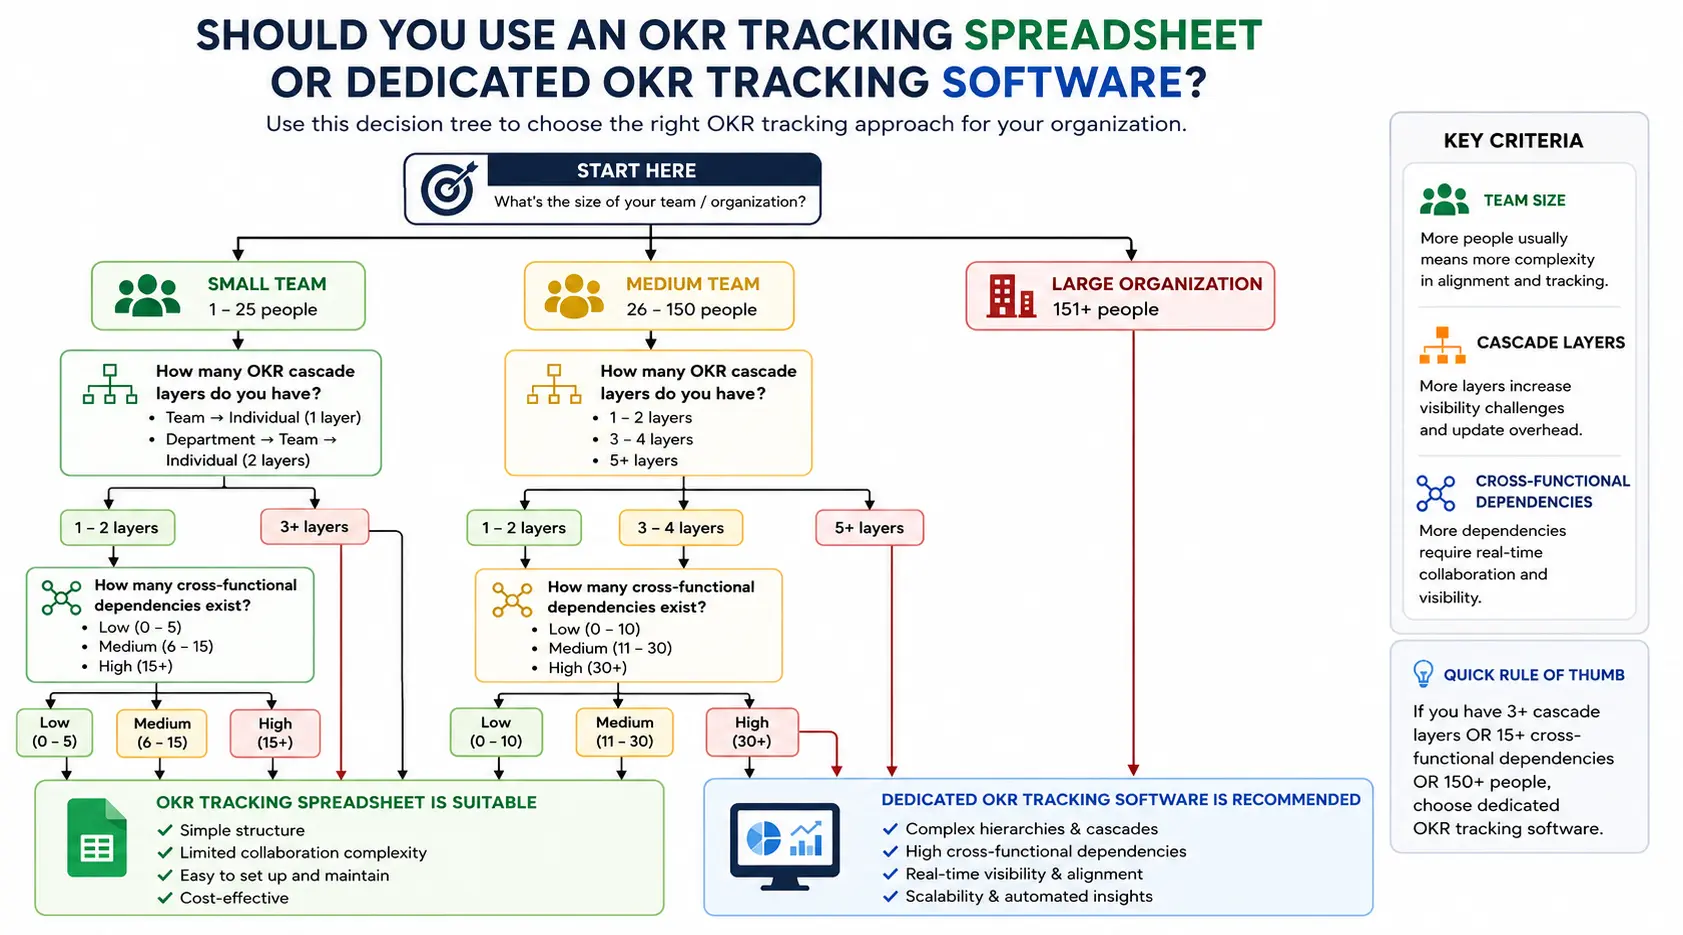
Stay on a spreadsheet if:
- You have one team, or your entire company reports to one leader with fewer than roughly 15 direct or indirect reports.
- You are in your first OKR cycle and still building the muscle of writing genuine outcome-driven goals rather than task lists. Adding software complexity on top of an unbuilt skill just gives people a more sophisticated way to write the wrong thing.
- Your check-in cadence is informal enough that everyone genuinely sees the same document weekly, in person or on one call.
Move to dedicated OKR tracking software when:
- You have more than one layer of management between the CEO’s priorities and the person doing daily execution. Cascade breaks silently in a spreadsheet; you find out about the break in the quarterly review, three months too late. This is exactly where organizational alignment starts to fracture without anyone noticing in real time.
- Your team OKR tracking spans more than two departments and cross-functional dependencies are being discovered mid-cycle instead of planned for at the start. This was the exact turning point in a European fintech I coached the CEO and CPO could not initially articulate outcomes in the right direction because there was no shared, structured view connecting product and commercial teams. Once we forced cross-functional co-ownership of a single Key Result between the Product Lead and an Account Executive, dependency conversations that had never happened before finally surfaced. This is also where departmental goals and tactical goals need to be visible to more than one team at once: something a spreadsheet tab per department actively works against.
- You are spending more time preparing the quarterly business review than running it. That is a data-aggregation problem software solves structurally; a spreadsheet solves it manually, every single quarter, forever.
- Your OKR tracking metrics need to answer “why” a goal moved, not just “what” the current number is. If your leadership team can’t reconstruct the story behind a missed Key Result without asking three people to remember what happened, you don’t have a tracking system, you have a filing cabinet.
What This Looks Like Inside the DEEP AI Framework
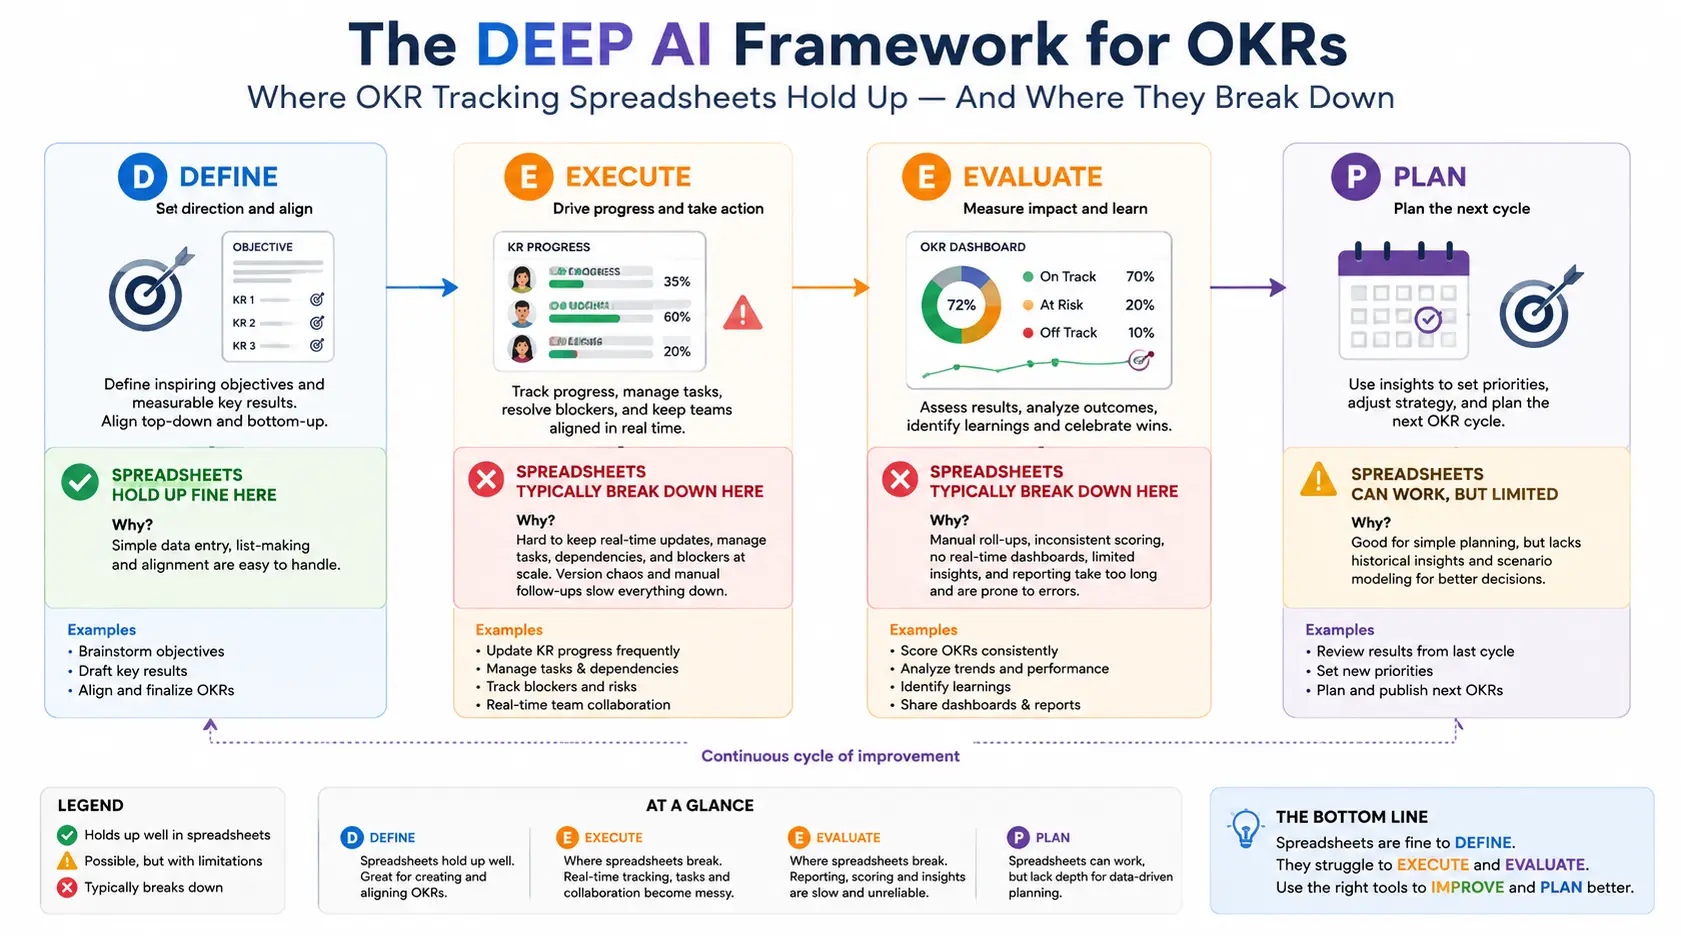
I built the DEEP AI framework — Define, Execute, Evaluate, Plan directly out of these implementation patterns, and each stage exposes exactly where a spreadsheet quietly stops working.
Define is where a spreadsheet does its best work. Writing goals, running the output-versus-outcome exercise with your team, drafting the first version of Key Results a shared document is genuinely fine here, sometimes even preferable, because it keeps the exercise low-stakes and collaborative. This is also the stage where leadership goals get set and company objectives get named work that benefits from a whiteboard feel, not a rigid system.
Execute is where spreadsheets collapse first. This is the daily and weekly rhythm of OKR check-ins confidence scores, blockers, at-risk flags and it is precisely the stage that requires automation, because check-ins that depend on someone remembering to update a shared file will erode within a quarter. If you want the specific cadence and question set that keeps this stage alive, our guide on running effective OKR check-ins covers the mechanics in detail.
Evaluate needs historical, structured data trend lines, not snapshots to run an honest retrospective. A spreadsheet gives you the number today. It rarely gives you the number from six weeks ago in a form anyone trusts, because someone has already overwritten that cell.
Plan is where the cycle-over-cycle learning happens, and this is only possible if Define, Execute, and Evaluate all fed clean data into the same place. A spreadsheet that gets rebuilt every quarter has no memory. Software that carries data forward does — and it’s what makes the next cycle’s strategic planning faster instead of starting from zero again.
A Field Observation: The 40-Person Startup That Waited Too Long
The pattern I see most often is a 30–50-person company still running its second or third OKR cycle on an OKR tracking spreadsheet, because “it’s working fine.” What’s actually happening is that the founder or a Chief of Staff is manually reconciling five departmental tabs every Friday afternoon, quietly absorbing the coordination cost that software would otherwise carry. Nobody budgets for that time because it’s invisible it just shows up as a leadership team that is permanently one step behind on OKR progress, always reacting to last week’s data instead of this week’s reality.
This pattern shows up even more sharply in distributed organisations, where there’s no hallway conversation to catch what the spreadsheet missed. If your team works remotely, the visibility gap widens faster we cover exactly how in OKR tracking for remote teams.
The tell is always the same: the moment someone asks, “can you pull up how we did on this three weeks ago” and the honest answer is “not without some archaeology,” the spreadsheet has already failed. The team just hasn’t admitted it yet, because the spreadsheet is free and switching feels like admin work nobody has time for.
Common Mistakes When Making This Decision
-
Choosing software before the org structure can support it.
If your organisational structure doesn’t reflect your actual growth priorities, you are cascading goals — automated or not — into a broken architecture. Fixing the tool before fixing the structure just makes the misalignment faster and better-looking.
-
Assuming bottom-up tracking works from day one.
Every OKR book recommends bottom-up goal-setting as empowerment, and the principle is sound — the timing is usually wrong. In the first two quarters of a new program, whether you’re in a spreadsheet or software, bottom-up tracking without coaching produces noise, not goal alignment. Start top-down with active coaching, and let bottom-up be where you arrive, not where you begin.
-
Buying software and stopping the coaching at the leadership team.
Setting the C-suite’s OKRs in a shiny new dashboard is the beginning of implementation, not the deliverable. If the coaching stops there, the program dies below the leadership layer within a quarter — regardless of which platform is displaying the (increasingly stale) goals.
-
Treating goal-completion rate as the success metric.
A team can complete 80% of its OKRs in a spreadsheet or the most sophisticated software on the market and produce no material business improvement if the goals weren’t genuinely outcome-driven to begin with. The metric that actually tells you whether your tracking is working is what I call the Execution Maturity Rate: the percentage of leaders who can independently write a genuine outcome-driven goal without coaching, a template, or a quality review. In a typical first-cycle implementation, that sits between 5% and 15%. In organisations that have been coached consistently for 12 months, it climbs to 30–40%. Neither a spreadsheet nor a dashboard report that number for you, you have to build the muscle first. Our piece on OKR tracking metrics that actually matter goes deeper on what to measure instead of completion percentage.
My Take
Alignment is agreement between teams on what matters, why it matters, and how each team’s work connects to the teams around it. You cannot set that in a tool spreadsheet or software. You can only display it once it already exists. A beautifully automated dashboard showing a perfectly cascaded goal tree is showing you the record of an agreement. If that agreement was never actually reached, the dashboard is just a better-looking fiction than the spreadsheet was.
So: use an OKR tracking spreadsheet honestly while you’re building the thinking. Move to dedicated OKR software the moment coordination cost, cascade layers, or cross-functional dependency starts outpacing what one shared document can hold. A platform that connects task management, performance management, and your existing stack through integrations with tools like Jira and Salesforce closes the gap a spreadsheet never can. And build the coaching either way because the tool only ever displays the discipline you already have.
Where to Go from Here?
If you’re ready to evaluate a platform: Worxmate’s OKR software connects check-ins, task management, and scorecards into one live system, so your OKR tracking never depends on someone remembering to update a shared file. See real-time OKR tracking in practice, explore what live OKR dashboards actually need to show at each leadership level, browse our full articles library for more on goal setting and execution, and book a demo when you’re ready.
If you recognise that the tool isn’t your first problem:
Most organisations that switch software before fixing outcome-thinking end up with a faster, better-looking version of the same confusion. Our OKR consulting work starts with the coaching: building the capability to write genuine outcome-driven goals and set real stretch goals before a single platform decision gets made. The software is the infrastructure. The coaching is the capability. You need both, in the right order.


Written by
An OKR Coach with 20+ years of implementation experience, Madhusudan has guided over 50 organisations through successful OKR transformations, training more than 500 leaders. Learn more about Worxmate.