 WORXMATE
Quick Answer
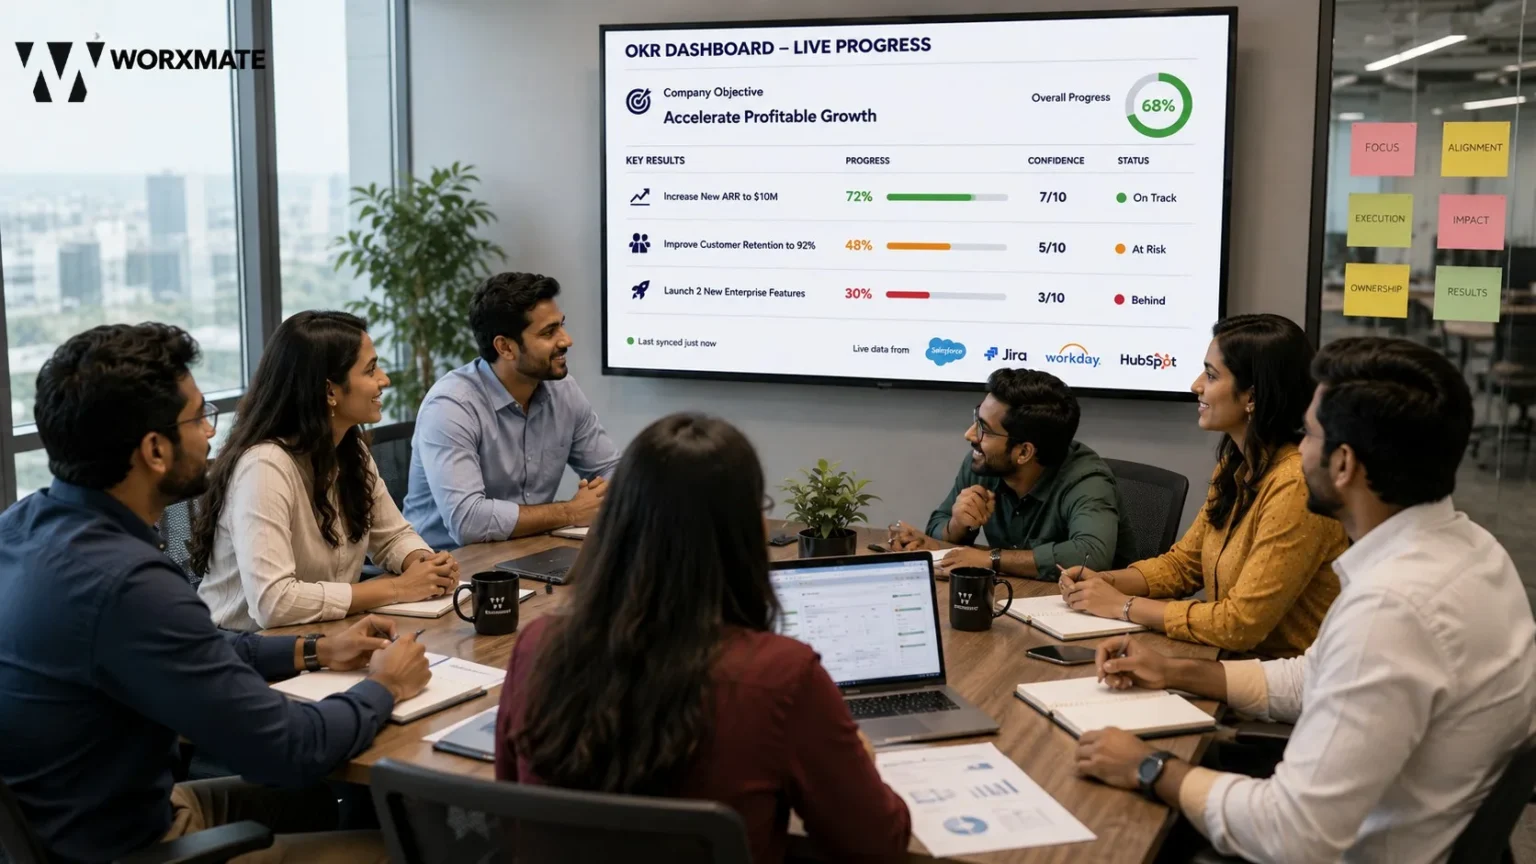
A real-time OKR dashboard automatically pulls Key Result data from the tools your team already works in — CRM, project management software, HRIS, dev platforms — the moment that data changes, instead of waiting for a manual update. Instead of a spreadsheet that’s accurate only on the day someone last touched it, leaders see current progress, confidence scores, and at-risk goals continuously, which is what makes fast, accurate decisions possible instead of decisions made three weeks late.
Summary
OKR dashboards real-time automatically sync live business data from your CRM, project tools, and HRIS directly to your strategic objectives. This eliminates manual updates and stale spreadsheets, ensuring your team always views current progress toward quarterly goals. With OKR dashboards real-time, organizations can detect risks instantly, pivot faster, and keep every employee—remote or in-office—aligned around a single source of truth.
Introduction: The Death of the Static Spreadsheet
Imagine discovering a major deal is about to fall through—not during a weekly sales meeting, but three days after the fact, because the spreadsheet was out of date. For modern managers, this lag is a liability.
We have moved past the era of quarterly planning as a “set it and forget it” ritual. In fast-paced markets, strategy must breathe. This is where OKR dashboards real-time become the central nervous system of an agile organization. Instead of manually begging for updates via email, a real-time OKR dashboard pulls data from the systems your team already uses.
Whether you are managing a remote workforce or scaling an enterprise, a live OKR monitoring tool transforms goals from static documents into dynamic conversations. It is the difference between driving while looking in the rearview mirror versus having a heads-up display.
This guide covers what actually qualifies as “real-time,” how enterprise teams structure live dashboards across leadership layers, where remote teams fit into the picture, and how real-time tracking sits inside a broader OKR tracking system not just a single dashboard screen.
Achieve Your Goals Faster
See how Worxmate can help your team set clear goals and achieve faster results. Book your free demo today and experience the power of AI-driven OKRs in action.
What Makes an OKR Dashboard “Real-Time”?
Not every dashboard deserves the “real-time” label. If a manager has to click “refresh” or wait for a teammate to manually input a number, it is merely “frequent,” not live.
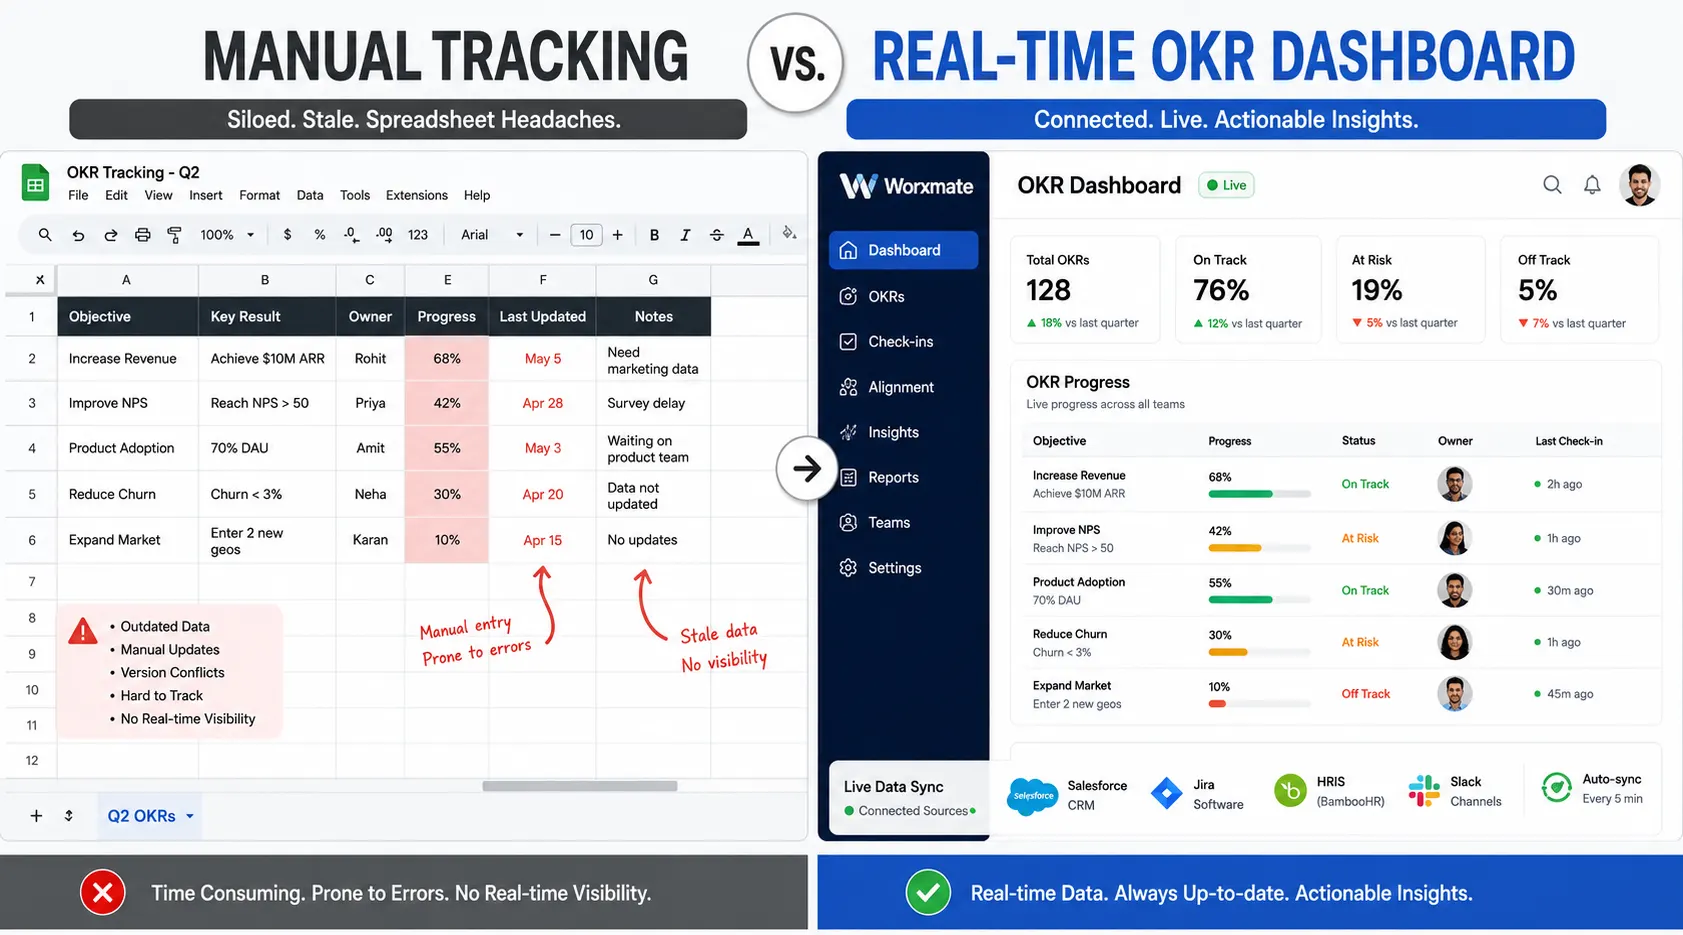
Manual vs. Automated Tracking
-
Manual: Excel sheets, Google Slides, email check-ins. High risk of human error, stale data, and “sandbagging” (adjusting numbers to look good).
-
Real-Time: Integration via API. A real-time OKR progress tracker pulls data directly from sources like Salesforce, Jira, or Zendesk. As the metric changes, the Key Result updates automatically .
Key Features to Look For
When evaluating an OKR tracking software real-time solution, look for:
-
Live Data Integrations: Does it sync with your CRM, database, or dev tools?
-
Confidence Scores: Beyond the numbers, a great live OKR monitoring tool lets owners score their confidence level weekly .
-
Automated Alerts: Notifications when a KR is “Off Track” or “At Risk” before the quarter ends.
 The Enterprise Need for Speed and Accuracy
For large organizations, the stakes are higher. An enterprise OKR real-time analytics suite isn’t just a luxury; it is a governance requirement.
Consider the architecture of a robust platform. According to industry best practices, enterprise dashboards must serve three distinct layers :
-
The Executive Dashboard (What?): A high-level summary of total ROI, leading indicator trends, and strategic alignment scores.
-
The Operational Dashboard (How?): Focused on process effectiveness, cycle efficiency, and capability development.
-
The Analytical Dashboard (Why?): Deep-dive tools for statistical modeling and predictive forecasting.
By separating these layers, an OKR dashboard with live data ensures that the CEO sees the weather forecast, while the project manager sees the current wind speed.
This three-layer split isn’t just a design choice — it maps to who is actually in the room. A CEO or strategy head cares about the executive view, because that’s where the next board conversation gets shaped. A BU head lives in the operational view, because that’s where blocked work actually gets unblocked. An ops or analytics team lives in the analytical view, because that’s where next quarter’s targets get set correctly instead of guessed at. Teams that skip this separation usually end up with one dashboard trying to serve all three audiences and satisfying none of them. Our guide on strategic priorities covers how to decide what belongs at each level before you build the dashboard around it, and our piece on organizational alignment is worth reading if the three layers are currently telling three different stories about the same quarter.
Case Study: How Datasite Saved $500K with Real-Time Visibility
The Company: Datasite (a global technology provider for the M&A lifecycle).
The Challenge: Datasite faced fragmented planning and delayed decisions. They were operating with 216 OKRs scattered across the organization, leading to an explosion of meetings. Leaders lacked real-time visibility into execution, resulting in siloed work and wasted productivity.
The Solution: Datasite implemented a unified strategy collection framework to streamline their objectives. They collapsed 216 OKRs down to just 3 primary objectives and 12 key results. To maintain visibility, they relied on AI-powered dashboards to provide real-time executive insights.
The Results (The Impact):
-
Eliminated over 4,000 meetings in just 5 months.
-
Saved $500,000 in recovered productivity costs.
-
Radical Focus: Reduced noise allowed teams to focus only on what moved the needle.
“Real-time visibility allows us to be agile. If the market shifts, we don’t need to wait for a monthly business review to pivot; we see the data live and react.” — Strategy Execution Lead, Datisite
This layered visibility problem isn’t unique to Datasite — it’s the same pattern covered in our guide to real-time performance dashboards, which looks at live tracking beyond just OKRs.
Solving the Remote Work Visibility Gap
Managing remote or hybrid teams introduces a unique problem: trust, but verify. Without line-of-sight management, leaders often resort to “check-in overload.” An OKR dashboard for remote teams solves this by focusing on output, not activity.
Accountability Without Micromanagement
A manager OKR reporting dashboard allows leaders to quickly see who is blocked and who is thriving. For remote employees, inputting progress becomes a 2-minute weekly check-in (What changed? Confidence score? Blockers?) rather than a 30-minute status meeting .
Remote teams using a real-time OKR progress tracker report higher alignment because everyone can see the “North Star” updated live, regardless of time zone.
Async doesn’t mean invisible it means the update has to survive the gap between when someone writes it and when their manager reads it three time zones later. A confidence score attached to a Key Result carries information a status bar cannot: a manager scanning a dashboard at 8am can see not just where a number sits, but whether the owner still believes in the target. That’s the signal that actually predicts which goals need a conversation this week, not next month.
This is also where OKR check-ins earn their place next to the dashboard, not instead of it. The dashboard tells a manager what changed; the check-in tells them why. Teams running distributed or hybrid setups get the most value from pairing a real-time OKR tracking for remote teams approach with a lightweight weekly check-in cadence, rather than leaning on either one alone. Our guide to team OKR tracking goes deeper into structuring that cadence across squads that rarely share a time zone. The distinction that matters most here is synchronous versus asynchronous trust: a co-located team can read a room; a remote team can only read what got written down — which is exactly why the confidence score field matters more for remote teams than for in-office ones.
Achieve Your Goals Faster
See how Worxmate can help your team set clear goals and achieve faster results. Book your free demo today and experience the power of AI-driven OKRs in action.
5 Benefits of Live OKR Monitoring
Switching to a live system yields immediate ROI. Here is what the data shows:
-
Reduced Coordination Time: One Fortune 500 company saw a 34% reduction in coordination time simply by automating their reporting .
-
Higher Data Integrity: Automated pulls eliminate the “Excel rounding error” that plagues manual updates.
-
Faster Decision Making: Strategic response time dropped from 14.2 weeks to 8.7 weeks in a major financial study .
-
Early Risk Detection: Automated flags catch “At Risk” goals weeks before they derail the quarter.
-
Strategic Agility: Teams can pivot quickly when a leading indicator turns red.
These five benefits compound rather than stack. Faster decisions surface more early-risk flags, which in turn improves data integrity because teams stop waiting until a number looks good before they update it. The pattern shows up consistently once a team moves off spreadsheets and onto live OKR tracking metrics: the conversation in weekly reviews shifts from reconciling numbers to actually discussing what to do about them. Early risk detection is usually the benefit that shows up fastest in practice a Key Result that would have quietly slipped for three weeks on a spreadsheet now shows amber the moment the underlying pipeline number stalls, which gives a manager time to intervene while there’s still a quarter left to fix it, rather than a postmortem to write. If the open question is which metrics are worth tracking in the first place versus which ones just create dashboard noise, our breakdown of real-time OKR tracking is a useful next read.
Overcoming Common Implementation Hurdles
Transitioning to an OKR tracking software real-time system isn’t without friction. Here is how to beat the two biggest obstacles:
The “Junk Data” Problem:
Fear: “If we connect live data, our dashboard will look bad.”
Reality: Bad data visibility is better than no data. An OKR dashboard with live data highlights process issues early. Many companies find that implementing OKRs actually improves their data hygiene, as teams are forced to define what “done” looks like quantitatively.
Update Fatigue:
Fear: “We already have too many tools.”
Reality: Real-time tracking replaces status meetings. A good live OKR monitoring tool integrates into Slack or Teams, allowing updates to happen in the flow of work, not as a separate chore.
The Migration Itself
There’s a third hurdle worth naming honestly: the migration itself. Teams that have run OKRs in a shared spreadsheet for two or three cycles have muscle memory built around that spreadsheet, even when everyone agrees it’s broken. The fix isn’t a mandate — it’s a side-by-side transition period where the dashboard runs alongside the spreadsheet for one cycle, so the team can see the two agree before they let the spreadsheet go. Sequencing matters more than most rollouts admit: connecting every integration on day one, before the team has even agreed on what a good Key Result looks like, tends to produce the exact junk-data fear teams are worried about. The better order is objectives first, one or two high-value integrations second, trust third, full integration list last. If your team is still deciding whether to make the move, our comparison of OKR tracking spreadsheets versus dedicated software and our step-by-step guide to OKR progress tracking are both worth reading before you migrate.
What a Real-Time Dashboard Can’t Fix: The Alignment Gap
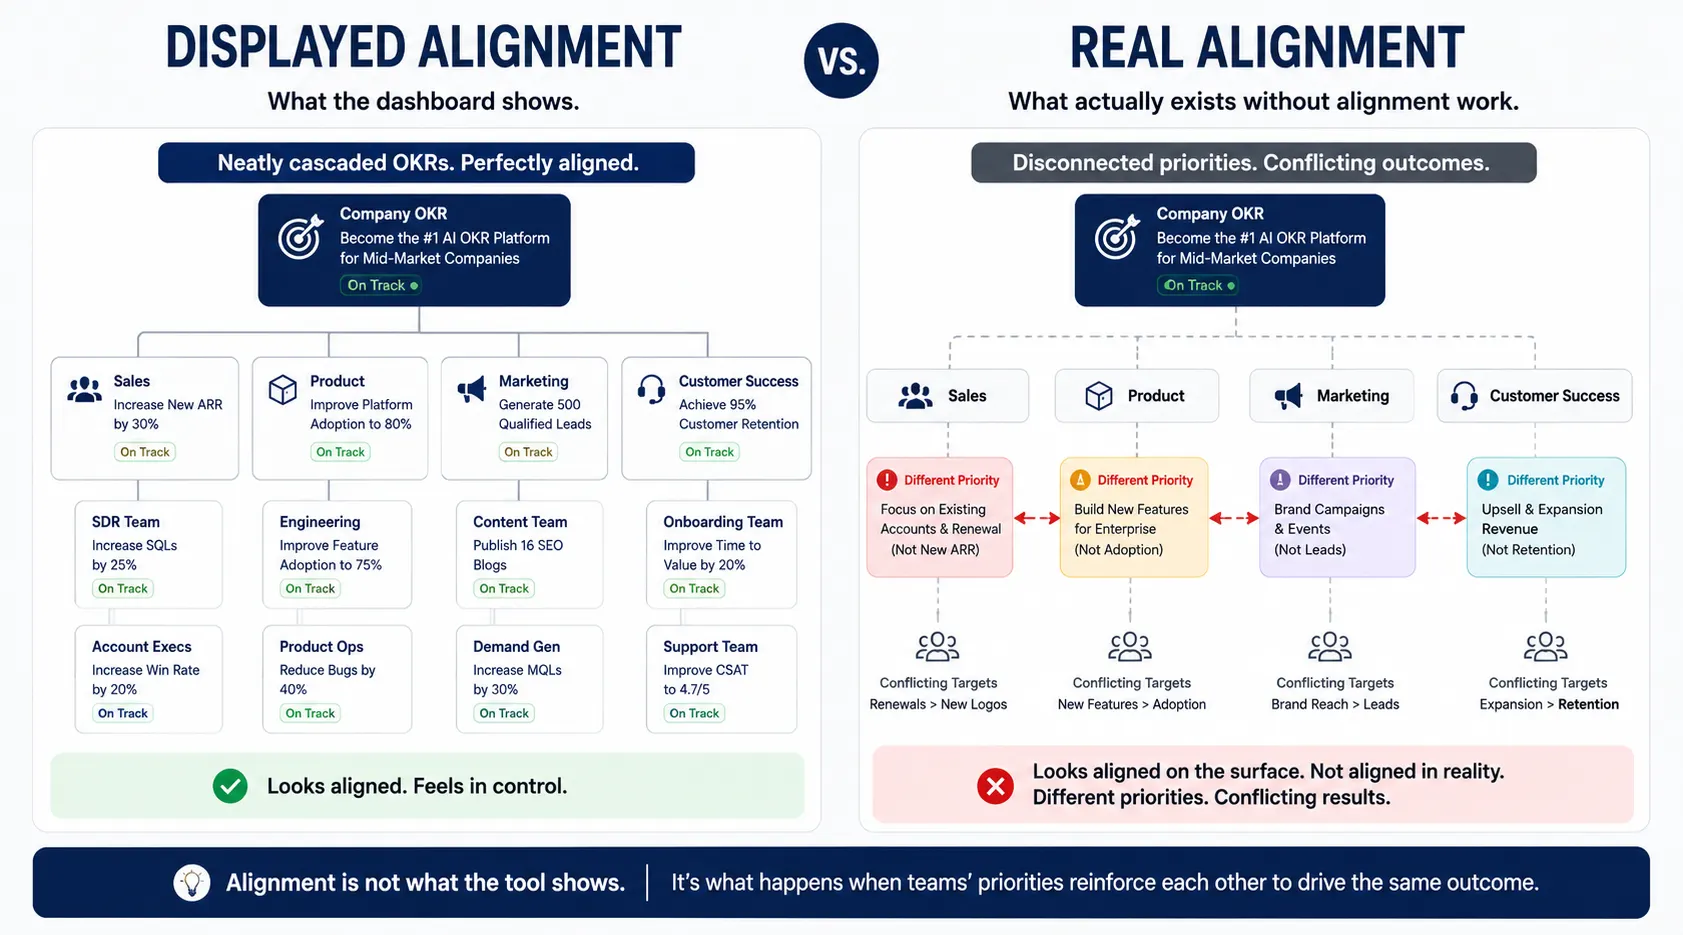
Here’s the belief that gets uncomfortable in enterprise rollouts: a dashboard can display alignment. It cannot create it.
Alignment is agreement between teams on what matters, why it matters, and how each team’s work connects to the work of the teams around them. You cannot set that in a tool. You can display it once it exists.
A platform that shows a beautifully cascaded OKR tree is showing you the record of an agreement that either exists or doesn’t. If the agreement doesn’t exist, the cascade display is a fiction and a real-time dashboard just makes that fiction update faster.
We’ve seen this play out inside large enterprise rollouts spanning thousands of employees, where every business unit had a sharp, well-run leadership team and still no shared read on what mattered most that quarter. The dashboard wasn’t the problem. The organization had never had the room-level conversation about which two or three priorities would actually move the business. The technology just made the disagreement visible in real time instead of hiding it in a quarterly slide deck.
This is why a live dashboard has to sit downstream of a real alignment conversation, not upstream of one. Before a team plugs in integrations and starts watching numbers move, it’s worth asking whether the objectives feeding that dashboard are genuine outcomes or busywork dressed up as outcomes. Our piece on what a business outcome actually is and how it differs from an output is a useful gut check before trusting any dashboard built on top of the goals underneath it. It’s also why so many OKR coaching engagements stall after the leadership workshop ends: the software gets rolled out to a team that was never coached on how to write outcome-driven goals in the first place, and the dashboard just displays that gap faster.
The practical takeaway: when you evaluate an enterprise OKR real-time analytics suite, don’t just ask whether it syncs data fast. Ask whether the objectives sitting on top of that data were built through a real cross-functional goal alignment process, or inherited from last quarter’s KPI list with a new label.
Why Worxmate is the Ultimate Real-Time OKR Solution
We have established that static spreadsheets are broken. You need software that bridges the gap between Strategic Planning and Real-time Execution. This is where Worxmate excels.
Worxmate is not just a goal-setting app; it is a comprehensive OKR & Performance Management System designed for the modern enterprise. Unlike basic trackers that feel like digital post-it notes, Worxmate provides deep, enterprise OKR real-time analytics through interactive PowerBI dashboards .
How Worxmate Solves the Real-Time Challenge:
-
Live Dashboards: Get a 360-degree view of the organization. Drill down from company-level objectives to individual Key Results instantly.
-
AI-Driven Insights: Our DeepAI engine analyzes sentiment and progress, proactively flagging risks to managers before they escalate .
-
Seamless Alignment: Worxmate connects daily tasks to high-level strategy, ensuring that your manager OKR reporting dashboard always reflects reality, not recency bias.
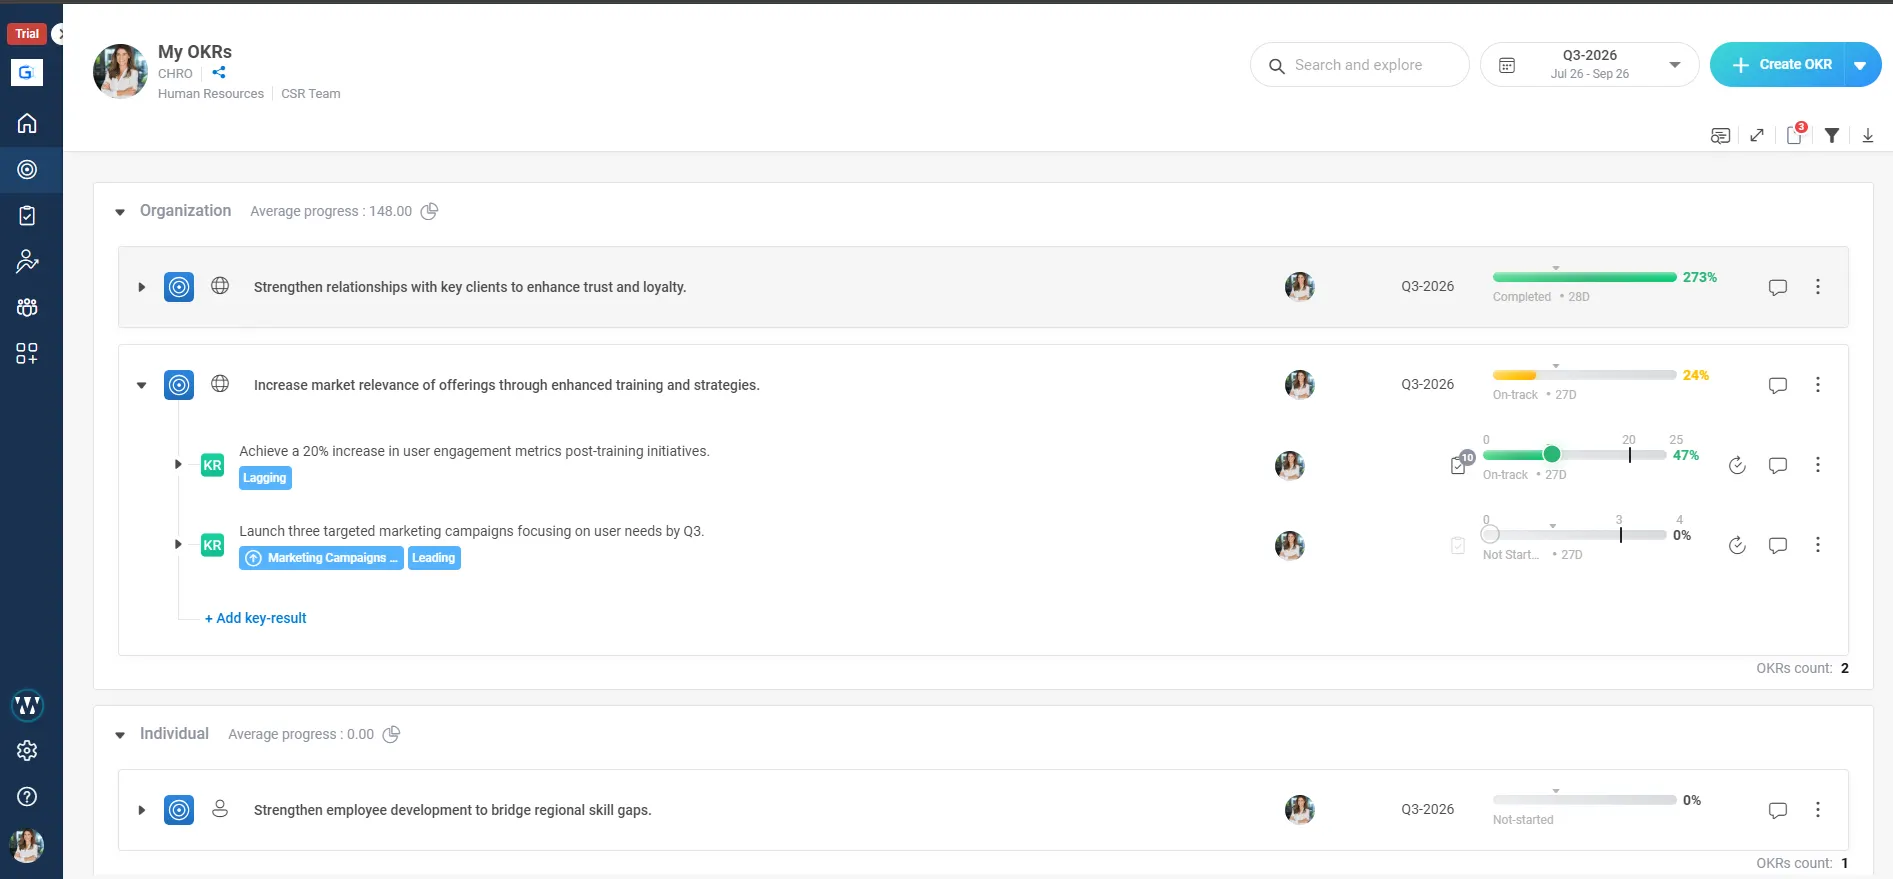
Worxmate’s Execute module is where daily and weekly progress actually gets logged, feeding the same live dashboards described throughout this guide, while the Axis engine handles the business performance analytics layer for enterprise leaders who need the executive and analytical views working off one dataset instead of three disconnected exports. This is part of what’s called the DEEP AI framework Define, Execute, Evaluate, Plan which maps to how organizations actually run a cycle, not how a slide deck says they should.
For teams still comparing purpose-built OKR software against HRIS platforms with a bolted-on goals module, or against spreadsheet-based tracking, the product comparison hub breaks down where each option actually holds up and where it doesn’t, before you commit budget to either one.
Don’t let your strategy get lost in a static spreadsheet.
The software is the infrastructure. The coaching is the capability. You need both, and in the right order.
If your team already has clarity on its objectives and just needs the tracking layer, explore Worxmate’s OKR Software and get a live walkthrough of the dashboards covered in this guide. If the harder problem is that your goals were never built through a real alignment process to begin with, that’s a coaching conversation before it’s a software one — our OKR consulting team has run that exact rebuild inside organizations from 100-person startups to 70,000-person enterprises.
For more on structuring OKRs across a distributed org, explore the full library of OKR articles and how-to guides, or schedule a demo with Worxmate to see it on real data.


Written by
An OKR Coach with 20+ years of implementation experience, Madhusudan has guided over 50 organisations through successful OKR transformations, training more than 500 leaders. Learn more about Worxmate.